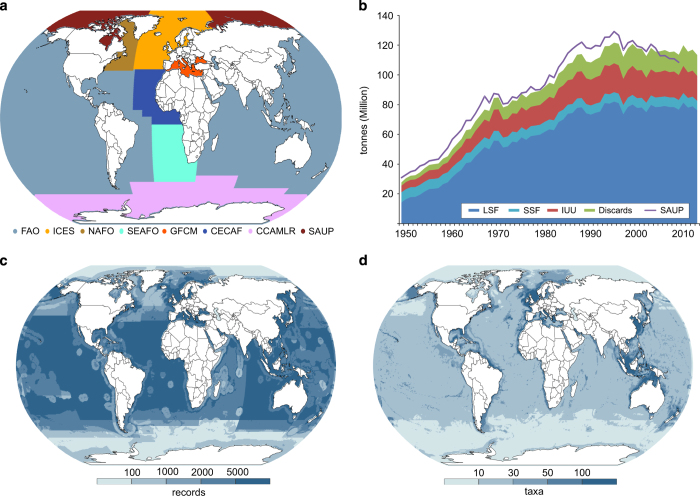
Figure 2. Breakdown of database contents.
(a) Map of database source coverage used (see Table 1); (b) Total tonnage and breakdown from 1950 to 2014, LSF is large-scale fishing, SSF is small-scale fishing, IUU is illegal and unreported fishing, Discards are rates of discard at sea and SAUP provides a comparison with the global total for on-line country catch reconstructions by SAUP18; (c) Map of number of database records; (d) Number of reported taxa.

