
Figure 1. 3D segmentation workflow in RMNH.PISC.24047 (Squatina squatina).
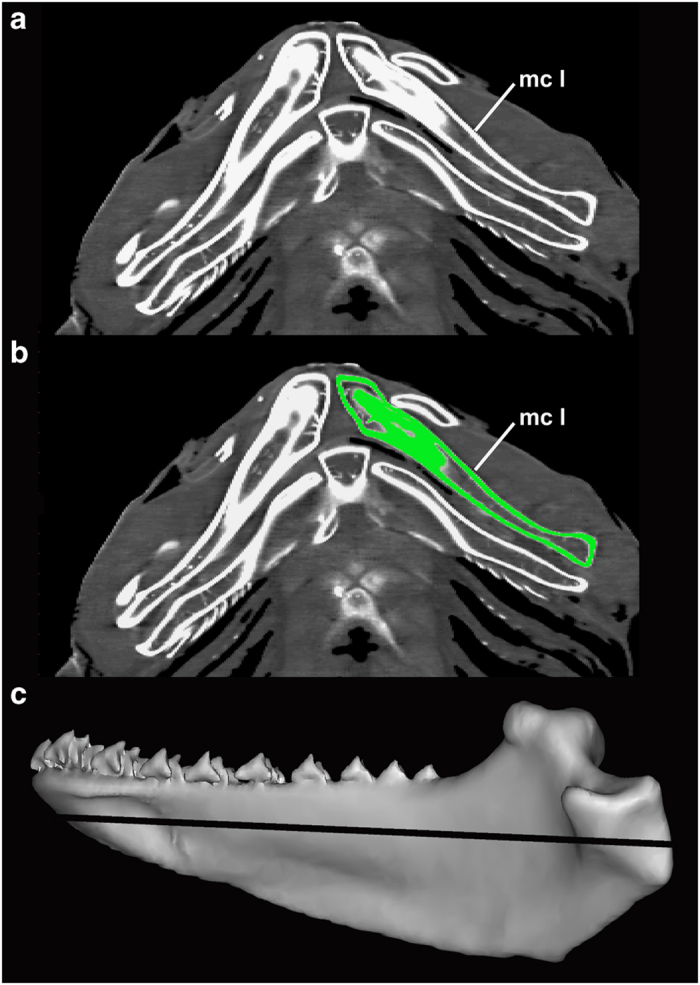
(a) Each CT scan is build up of multiple slices (tomograms) showing structures with high attenuation of X-rays bright and structures with low attenuation dark, using a grey scale. Each pixel in the tomogram is associated with a Hounsfield unit. (b) A mask (green) is superimposed on the left lower jaw. This mask is based on predetermined threshold values of the Hounsfield unit of to produce an exact overlay on each tomogram. (c) When in each slice a mask is superimposed on the left lower jaw a 3D model is calculated based on the mask. The black line through the 3D model indicates the location of the tomogram in (a,b), mc l=left lower jaw.