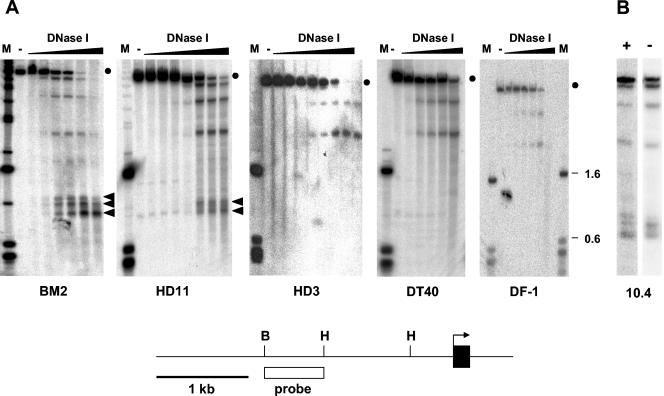
FIG. 1.
Analysis of DNase I-hypersensitive sites upstream of the mim-1 gene. The strategy used for mapping DNase I-hypersensitive sites in the chromatin of the chicken mim-1 gene is illustrated schematically at the bottom of the figure. The first exon is depicted as a black rectangle, and the arrow points in the direction of transcription. Relevant restriction sites are marked as follows: H, HindIII; B, BglII. The white rectangle marks the region that was used as the hybridization probe. (A) Nuclei from BM2, HD11, HD3, DT40, and DF-1 cell lines were treated without (lanes −) or with increasing concentrations of DNase I, as indicated. DNA isolated from the nuclei was then digested with HindIII and analyzed by Southern blotting by using the probe shown at the bottom. Lanes M contain size markers. The lengths (in kbp) of some of the fragments are indicated at the right. The full-length genomic fragments detected by the probe are marked by dots. Bands which are not present in lanes lacking DNase I and whose intensity increases with increasing DNase I concentration represent DNase I-hypersensitive sites. Bands corresponding to the mim-1 enhancer are marked by arrowheads. (B) Nuclei from 10.4 cells grown in the presence (+) or absence (−) of 2 μM β-estradiol were analyzed as described for panel A. Only one lane of the DNase I digestion kinetics is shown in each case.

