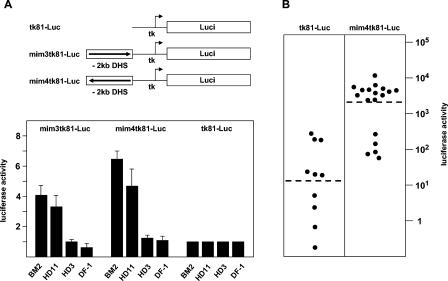
FIG. 2.
Activity of mim-1 reporter genes in different cell lines. (A) Luciferase reporter genes are illustrated schematically at the top. The arrows indicate the orientation of the insert fragments relative to the tk promoter. Cell lines were cotransfected by calcium-phosphate coprecipitation (HD11, DF-1) using 2 μg of the indicated reporter genes and 0.2 μg of the β-galactosidase plasmid pCMVβ or by electroporation (BM2, HD3) using 5 μg of luciferase reporter gene and 5 μg of CMVβ. Cells were harvested 24 h after transfection and analyzed for luciferase and β-galactosidase activity. The columns show the average luciferase activity normalized with respect to the activity of the cotransfected β-galactosidase plasmid. The T bars show standard deviations. The activity of the reporter gene containing only the thymidine kinase promoter (tk81-Luc) was designated 1. (B) BM2 cells were electroporated with the indicated reporter genes and a plasmid containing the neomycin resistance gene under the control of the actin promoter. Clones of stable transfectants were then analyzed for luciferase activity. Each point represents an individual clone. Luciferase activities (shown on a logarithmic scale) were determined from similar numbers of cells for each clone and were normalized with respect to the amount of integrated luciferase construct, determined by Southern blotting. The average activity of all clones of the same type is indicated by the broken lines.

