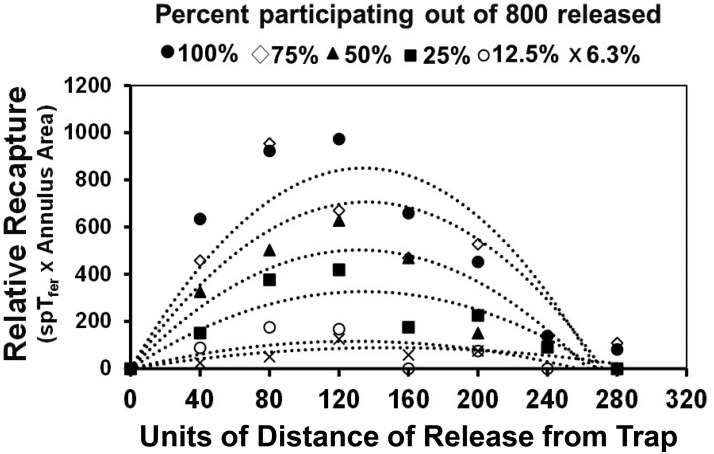
Fig. 1.
Computer simulation results showing change in pattern of capture profiles to be expected if not all of the codling moths released into the forthcoming experiments lived. Individuals not participating simulate those killed by an insecticide. SpTfer indicates proportion of insects captured after release at a particular distance, for the purpose of this demonstration always calculated on the basis of 800 movers released. Annulus area indicates a ring out of the full trapping area (composite of all annuli) sampled by a single trap. In all cases, the CSD for headings for new steps was 30° and the total number of steps was 3,000. The trend lines were fit using a second-order polynomial.

