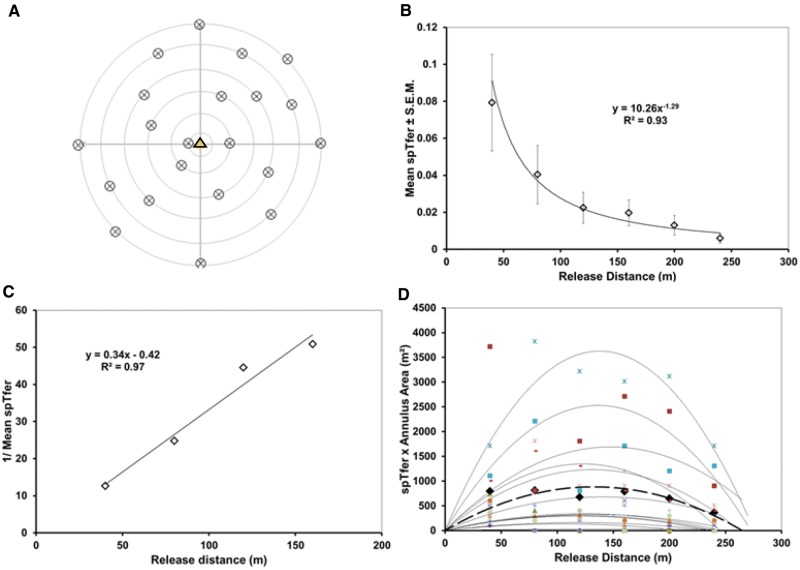
Fig. 5.
Experiment 3, low-population over 18 ha. A. Pattern of moth release. One trap was deployed at the center of this array. B. Mean spTfer versus distance for 15 low-population runs. C. The MAG plot transformation of mean spTfer data. D. Miller plot transformation for each of the 15 replicates and their mean (bold dashed line).

