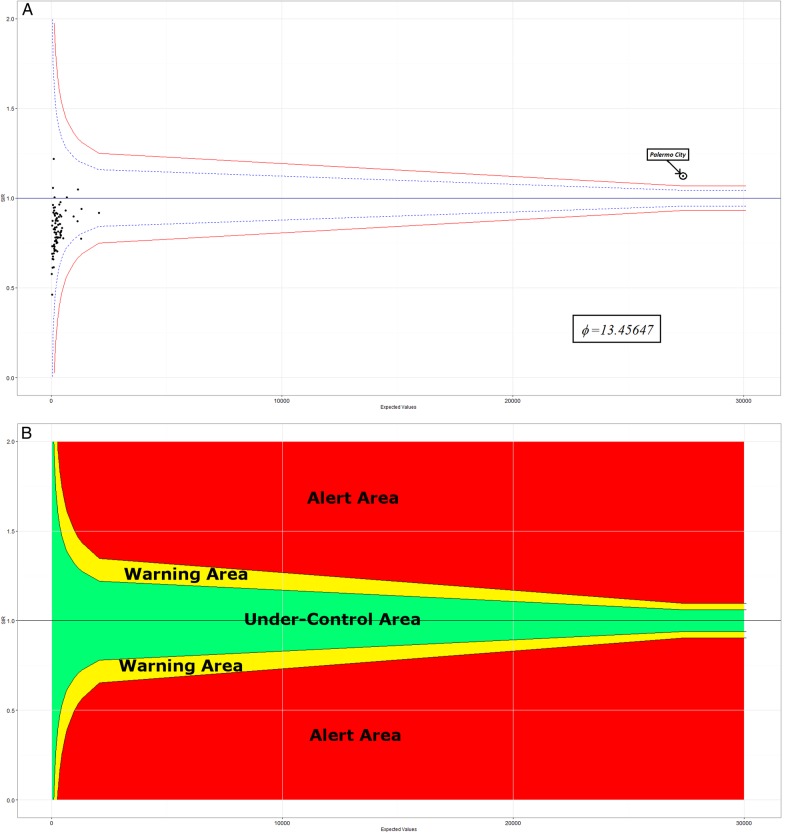
Figure 1.
(A) Funnel plot of the SIRs in the 82 Palermo Province municipalities (study period 2003–2011); (B) cancer attention areas: ‘undercontrol’ area (in green), ‘warning’ area (in yellow) and ‘alert’ area (in red). Ninety-five per cent CIs (‘blue’ control lines) and 99.8% CIs (‘red’ control lines); ϕ=overdispersion, calculated with multiplicative approach. SIR, standardised incidence ratio.

