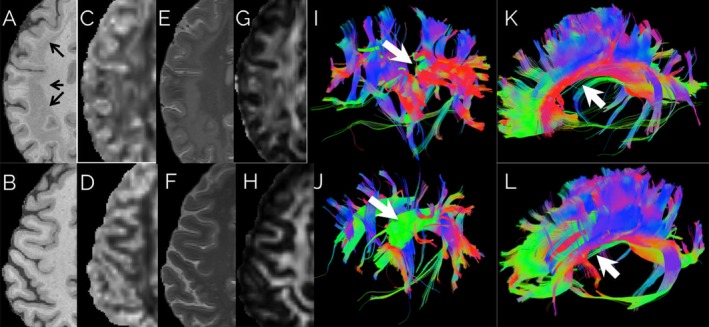
Figure 1.

Patient (top row) and age‐matched healthy control (bottom row). (A–H) First four columns show T1‐weighted magnetization prepared rapid acquisition GRE, orientation dispersion index (ODI) derived from NODDI imaging, T2‐weighted MRI, and fractional anisotropy, respectively. Band heterotopia (arrows) clearly delineated in a bilateral band located between the ventricular wall and cortical mantle. ODI map shows aberrant neurite dispersion in white matter regions as compared to healthy control ODI map. (I–J) The fifth column shows tractography obtained by seeding the normal location of the superior longitudinal fasciculus. (K–L) The sixth column shows tractography obtained by seeding the genu, body, and splenium of the corpus callosum. 3D tract maps are shown in an oblique lateral view, with anterior to the left. The colors represent the direction of the fiber tracts using standard labeling. Most large tracts, such as callosal fibers, could be followed through the heterotopic tissue; however, the superior longitudinal fasciculus (white arrow) was attenuated compared to the control.
