Figure 2.

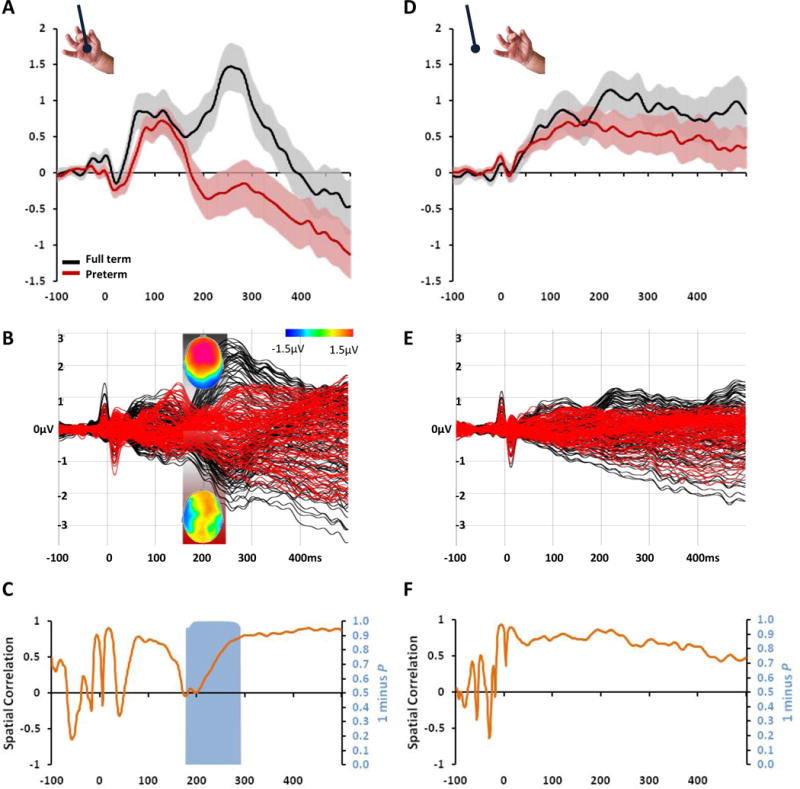
Impaired ERP responses to light touch in preterm infants. A. Group-averaged ERPs from full-term and preterm infants (black and red traces, respectively; s.e.m. shown) at a left frontal scalp site. B. Overlay of ERPs from the entire electrode montage. Insets show mean ERP topographies over the 171–240ms period (top view) when significant differences were observed (Table 1). C. The orange curve displays the spatial correlation between ERPs from full-term vs. preterm infants. The blue area displays statistically significant differences in ERP topography, indicative of differences in the active brain circuits in responses from full-term vs. preterm infants. Corresponding data and analyses in response to sham stimuli are shown in d–f. No statistically reliable differences were observed. For preterm patient characteristics see Table S1.
