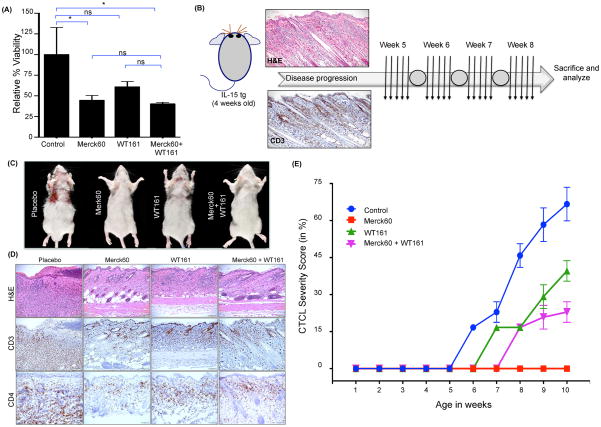
Figure 6. Targeting HDACs for treatment of CTCL in vitro and in vivo.
(A) The human CTCL cell line Hut78 was treated with 150nM HDAC inhibitors to test the efficacy of specific HDAC inhibition on cell viability. Relative percent viability of treated cells was measured by the MTS assay 72 hours after treatment and the values for control treated cells were arbitrarily set at 100% (mean ± SEM, N=4 for each condition). (B) Treatment schema for approximately 4 week old CTCL IL-15 tg mice with either Merck60 and/or WT161 (N=4/group). Representative H&E and CD3 immunohistochemical staining in skin tissue of CTCL IL-15 tg mice on day 0 (week 4) of treatment. Each arrow indicates a daily dose of drug(s) or placebo, and each circle indicates a 2-day weekend drug holiday (see Methods for details), followed by sacrifice and analysis 2 days after the discontinuation of therapy. (C) Representative autopsy photographs taken upon sacrifice at the end of treatment showing progression of CTCL or lack thereof in each treatment group. (D) Representative histological findings across the four treatment groups showing the extent of CTCL infiltrates (H&E staining, top row). Skin sections from each treatment groups were also stained for CD3+ and CD4+ T-cell infiltrates (middle and bottom row, respectively). (E) CTCL severity of IL-15 tg mice treated with either Merck60 and/or WT161 (N=4/group). Unless otherwise stated, data is presented as mean ± SEM, nsP > 0.05, *P ≤ 0.05, **P ≤ 0.01, ***P ≤ 0.001, unpaired two-tailed student’s t-test.

