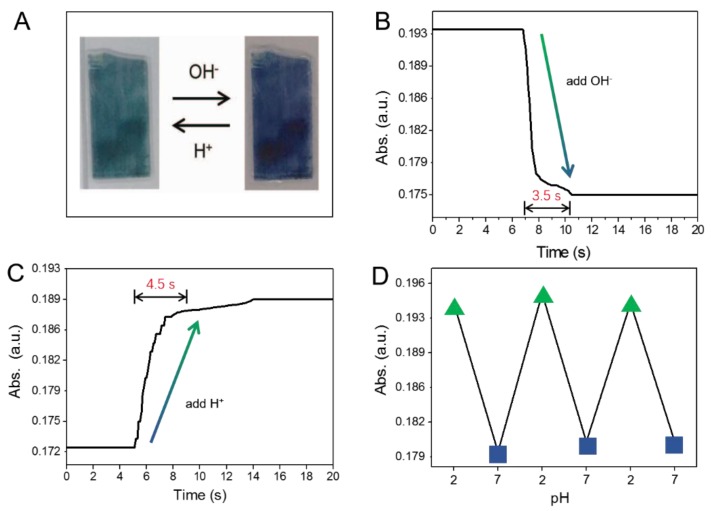
Figure 6.
(A) Optical images of PANI-GNPs-glass, showing the color changes between acid (low pH) and alkaline (high pH) medium; (B) The response curve from acid medium (pH = 2) to alkaline medium (pH = 7) at 785 nm; (C) The response curve from alkaline medium (pH = 7) to acid medium (pH = 2) at 785 nm; (D) The absorbance changes of PANI-GNPs-glass biosensor at 785 nm upon switching between pH = 2 and 7 media (three cycles).

