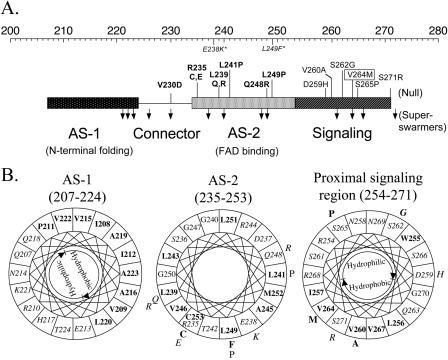
FIG. 5.
Mutations altering Aer activity mapped onto regions of the HAMP and proximal signaling domains. (A) Segment of Aer representing helical (rectangle) and undefined connector (line) regions of the HAMP and contiguous signaling domains. The top scale represents the amino acid residue numbers. Mutations which abolished FAD binding are in bold, those that bound FAD but had null activity are in plain text, and those that caused superswarming are represented by downward arrows. V264M inverted the response and is shown boxed. Mutations in italics and followed with an asterisk denote two null mutants reported previously by Bibikov et al. (8). (B) Null mutations mapped onto the helical wheels from Fig. 2. Individual mutations are placed outside of the wheel. See the legend to Fig. 2 for the key.

