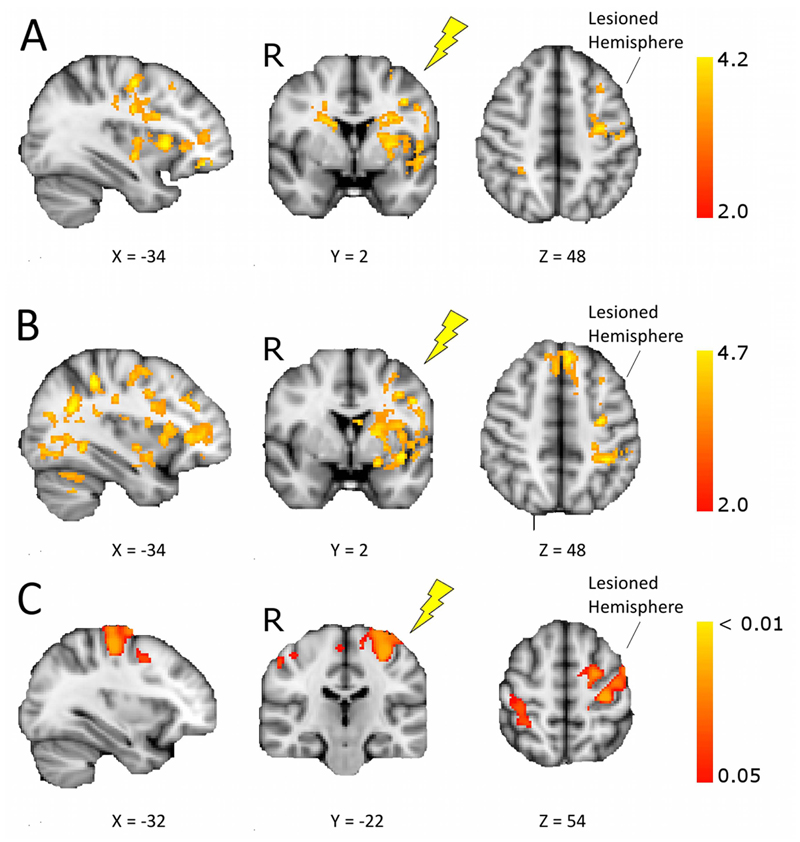
Figure 2. Increased fMRI activity and gray matter volume in the anodal tDCS group compared to the sham treatment group.
Shown are changes in fMRI activation and gray matter volume before and after intervention in stroke patients receiving motor rehabilitation plus anodal tDCS or sham treatment (post>pre, anodal>sham, voxel-wise General Linear Model, p<0.05 corrected). Images are in radiological convention (R – right), and all lesions appear on the left, the target for tDCS (yellow flash). The X or Y coordinates for each brain slice are given below the slice. (A) Brain regions showing increases in fMRI activity during affected hand movement from baseline to immediately post-intervention for the anodal tDCS group versus the sham treatment group. (B) Regions showing greater increases in movement-related fMRI activity for anodal tDCS versus sham group from baseline to one month follow-up. See table S1 for the location and Z statistic of peak voxels from fMRI analysis. (C) Brain regions showing increases in gray matter density as assessed by voxel-based morphometry (VBM), from baseline to immediately post-intervention for the anodal tDCS group versus the sham treatment group.

