
Figure 2.
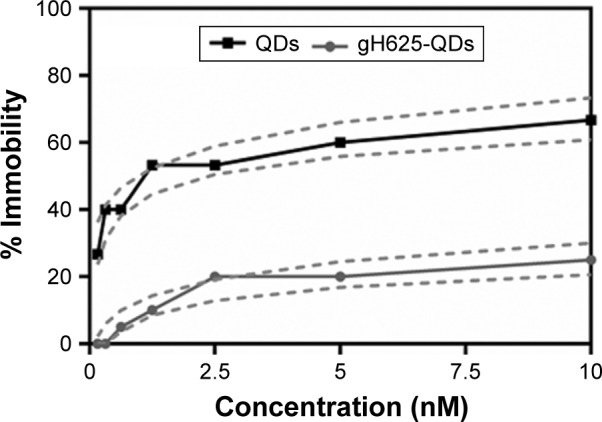
Immobility of Daphnia magna exposed to QDs and gH625-QDs for 48 h; dashed line represents confidence intervals.
Notes: The concentrations reported are relative to QDs (the concentration of 10 nM QDs corresponds to a peptide concentration of 43 µM). Data are reported as mean ± SEM (n=9). Bonferroni post hoc test following two-way ANOVA versus the QDs group. All the data present significant differences (P<0.001).
Abbreviations: ANOVA, analysis of variance; QDs, quantum dots; SEM, standard error of the mean.