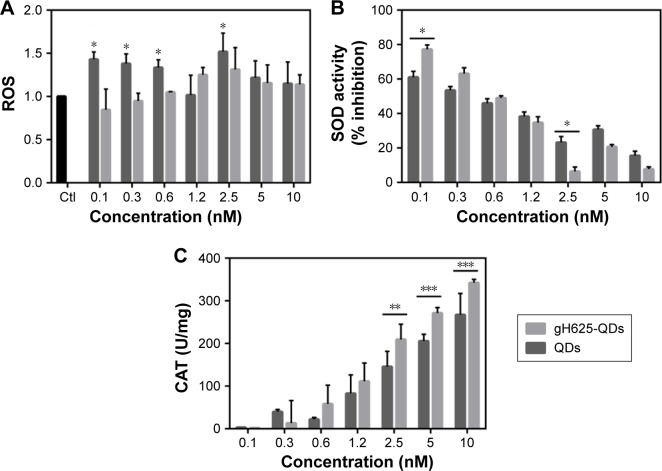
Figure 6.
Response of Daphnia magna to oxidative stress on exposure to QDs and gH625-QDs for 24 h.
Notes: (A) ROS production by dichlorofluorescein fluorescence. Data are given as fluorescence values (mean ± SEM [n=9]). *P<0.05, **P<0.01 and ***P<0.001, Tukey post hoc test following one-way ANOVA versus the control group (Ctl). (B) CAT activity is expressed as units* mg−1 of protein mean ± SEMs (n=9). *P<0.05, **P<0.01 and ***P<0.001, Bonferroni post hoc test following two-way ANOVA versus the QDs group. (C) SOD activity is given as percentage of SOD inhibition compared to the control mean ± SEMs (n=9). *P<0.05, **P<0.01 and ***P<0.001, Bonferroni post hoc test following two-way ANOVA versus the QDs group. All the data show significant differences (P<0.05) compared to the control group (Ctl).
Abbreviations: ANOVA, analysis of variance; CAT, catalase; QD, quantum dot; ROS, reactive oxygen species; SD, standard deviation; SEM, standard error of the mean; SOD, superoxide dismutase.

