
Figure 2.
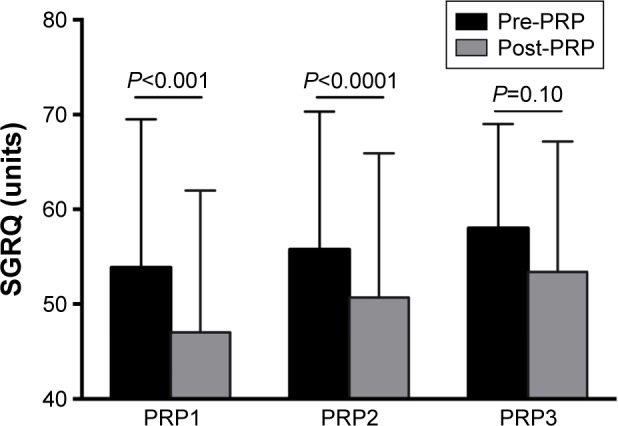
Grouped column graph of mean SGRQ pre-PRP (black) vs post-PRP (gray) for each PRP session.
Notes: Error bars represent standard deviations. Mean improvement was 7.0 units after PRP1 and 4.9 units after PRP2. There were significant reductions in SGRQ following PRP1 and PRP2 (P<0.001) but not after PRP3 (P=0.10).
Abbreviations: PRP, pulmonary rehabilitation program; SGRQ, St George’s Respiratory Questionnaire.