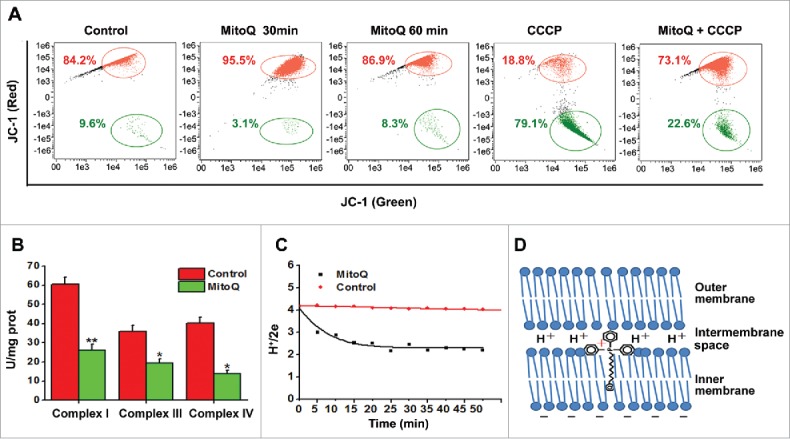
Figure 3.

Generation of pseudo-mitochondrial membrane potential (PMMP) by MitoQ. (A) Fluorescence of HepG2 cells stained with JC-1 was determined by flow cytometry. (B) The activities of respiratory chain complexes related to proton production were detected using commercial kits. (C) After different treatments with MitoQ, the rates of proton pumping were measured with a fast-responding pH electrode system. (D) Schematic diagram of MitoQ on the mitochondrial membrane. All data are presented as mean ± SEM from 3 independent experiments. *P < 0.05, **P < 0.01 vs. control.
