
Figure 4.
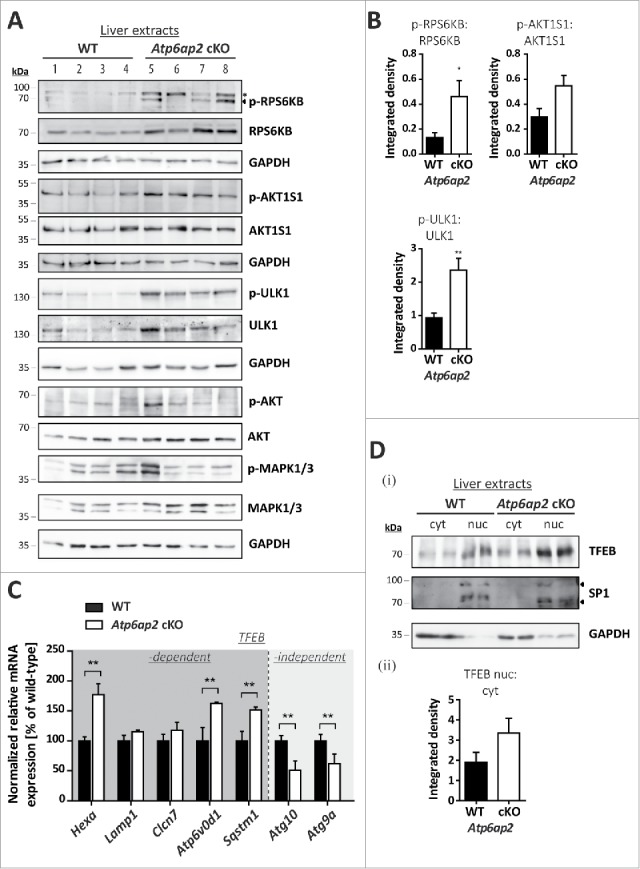
MTORC1 is active in liver bearing decreased v-H+-ATPase levels. (A) Phosphorylation of the MTORC1 targets RPS6KB and ULK1 as well as of the MTORC1 repressor AKT1S1 and the insulin-responsive kinases MAPK1/ERK2-MAPK3/ERK1 (Thr202, Tyr204) and AKT (Ser473) was analyzed by immunoblotting of 4 different wild-type control (WT, lanes 1–4) and 4 Atp6ap2 cKO liver extracts (lanes 5–8) and revealed increased signaling activity in the Atp6ap2 cKO samples. GAPDH staining was used to control for equal protein loads. Irrelevant bands according to the antibody datasheet are labeled with *. (B) Signal intensities from (A) were quantified in regard to the extent of protein phosphorylation and compared between both genotypes. Shown are means ± standard errors from 4 independent liver preparations per genotype. * P < 0.05, ** P < 0.01 according to unpaired, 2-tailed Student t test. (C) Transcription of TFEB-dependent and -independent genes involved in autophagy and lysosomal biogenesis was analyzed by qRT-PCR using whole liver RNA extracts of wild-type and Atp6ap2 cKO animals. Expression levels were normalized to the most stable housekeeping genes and related to the wild-type expression rate. Bars represent mean values of 6 independent RNA preparations per genotype ± standard errors (** P < 0.01 according to unpaired, 2-tailed Student t test between genotypes). (Di) Fractionation of cytosolic (cyt) and nuclear (nuc) proteins from wild-type and Atp6ap2 cKO livers. TFEB displays prominent nuclear localization in both genotypes. SP1 and GAPDH were used as specific nuclear or cytosolic positive control, respectively. (Dii) Quantification of data obtained in (Di) regarding the ratio of nuclear to cytosolic TFEB. Shown are mean values ± standard errors of 6 independent preparations per genotype.