
Figure 2. Variance analysis of calcium signals reveals NMDAR detection of extracellular glutamate at MSN spines.
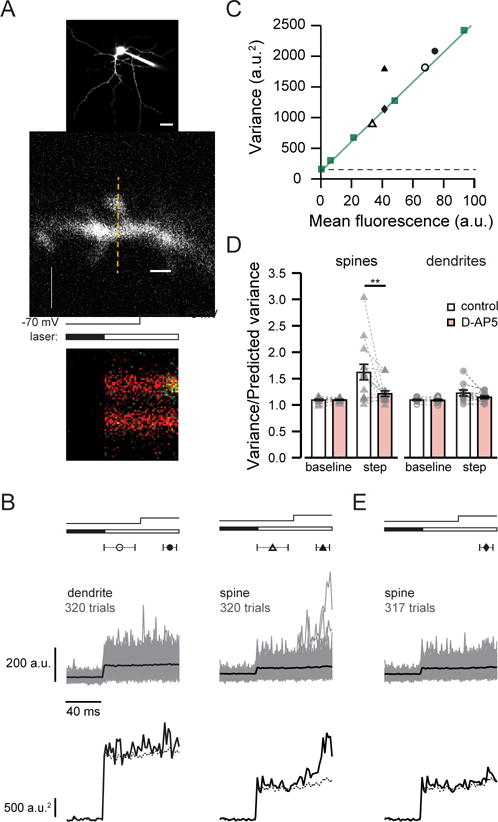
(A) top, 2PLSM image of MSN filled with Alexa 594 and Fluo-5F. Scale bar: 20 μm. middle, MSN dendritic spine and shaft showing line scan position (dashed line) Scale bar: 2 μm. bottom, line scan showing fluorescence in the green channel increasing sharply during depolarization in the spine but not the dendrite. Timing of depolarization and shutter opening indicated above.
(B) Fluo-5F fluorescence (upper traces, average in black) and variance (lower traces) from 320 trials from the dendrite shaft and spine shown in (A). Symbols indicate the times used to calculate baseline (open) and step (closed) fluorescence and variance. Predicted variance (dashed line) reflects the sum of dark noise and the shot noise of the mean fluorescence signal. Timing of depolarization and shutter opening indicated as in (A).
(C) Baseline (open symbols) and step (closed symbols) variance versus mean fluorescence for the spine (triangles) and dendrite shaft (circles) shown in (A). Measurements of pipette fluorescence (squares) reflect shot noise; the slope of the line fit (green) was used to calculate predicted variance. Variance due to dark noise indicated by dashed line.
(D) Summary graphs show measured variance normalized to predicted variance in spines and dendrite shafts. D-AP5 reduced step variance in spines but not dendrite shafts, and did not affect baseline variance. Data are represented as mean ± SEM; individual pairs in grey.
(E) Removal of three of 320 trials shown in (B) greatly reduced step variance for the spine. The variance of the remaining trials is predicted by shot noise, as shown also in (C) with closed diamond.