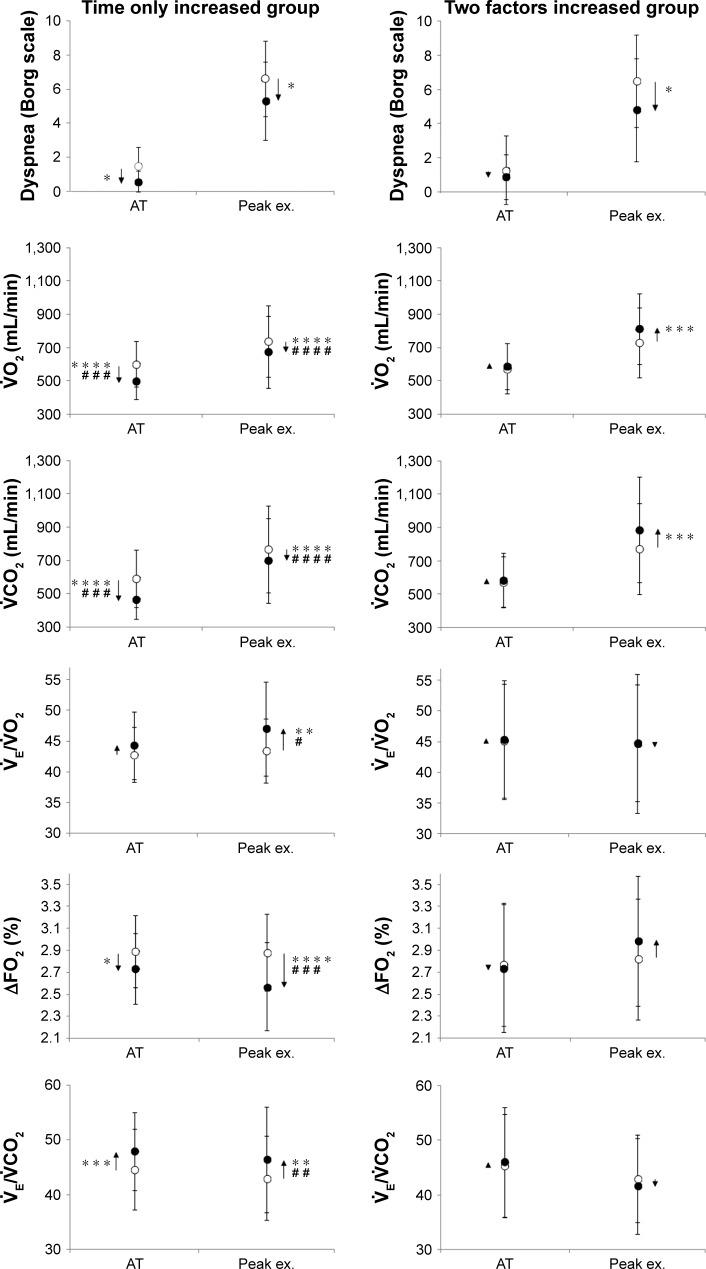
Figure 4.
The changes of exercise variables before and after pulmonary rehabilitation.
Notes: In the time only increased group, the data for peak exercise in 18 patients and the data for AT, which were obtained at both pre- and post-PR, in 12 patients were used. In the two factors increased group, the data for peak exercise in 11 patients and the data for AT, which were obtained at both pre- and post-PR, in 10 patients were used. The post-PR results are compared with the pre-PR results within each group (*P<0.05, **P<0.01, ***P<0.001, ****P<0.001) and between the two groups (#P<0.05, ##P<0.01, ###P<0.001, ####P<0.001) using paired t-tests and unpaired t-tests, respectively.
Abbreviations: AT, anaerobic threshold; ΔFO2, the inspired oxygen concentration (FiO2) minus expired oxygen concentration (FeO2); peak ex., peak exercise; , carbon dioxide output; , minute ventilation; , oxygen uptake.

