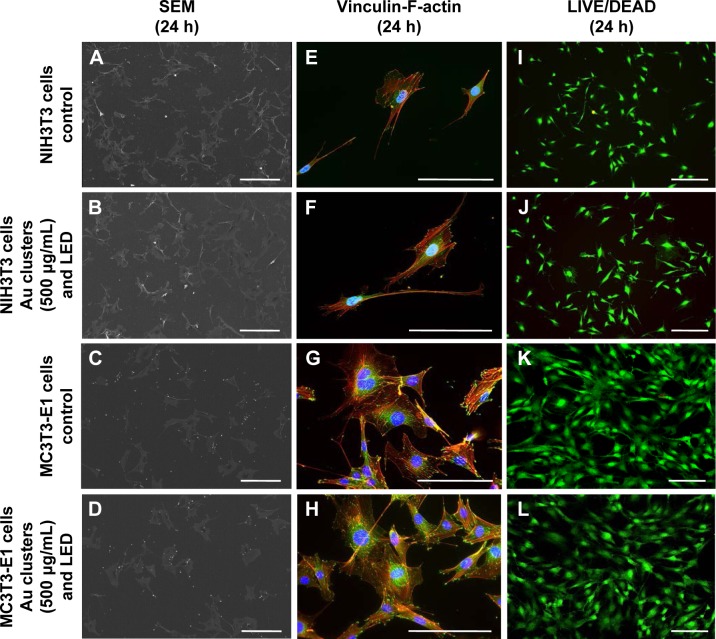
Figure 5.
Evaluation of cell morphology after 24-h incubation.
Notes: (A–D) SEM observation. (E–H) Vinculin-F-actin double staining. (I–L) LIVE/DEAD BacLight staining. The morphology of NIH3T3 and MC3T3-E1 cells following application of Au clusters and LED irradiation was similar to that of control (no application of Au clusters and no light irradiation). Scale bar represents 200 μm (A–D), 50 μm (E–H), and 100 μm (I–L).
Abbreviations: LED, light-emitting diode; SEM, scanning electron microscopy.

