Figure 3.
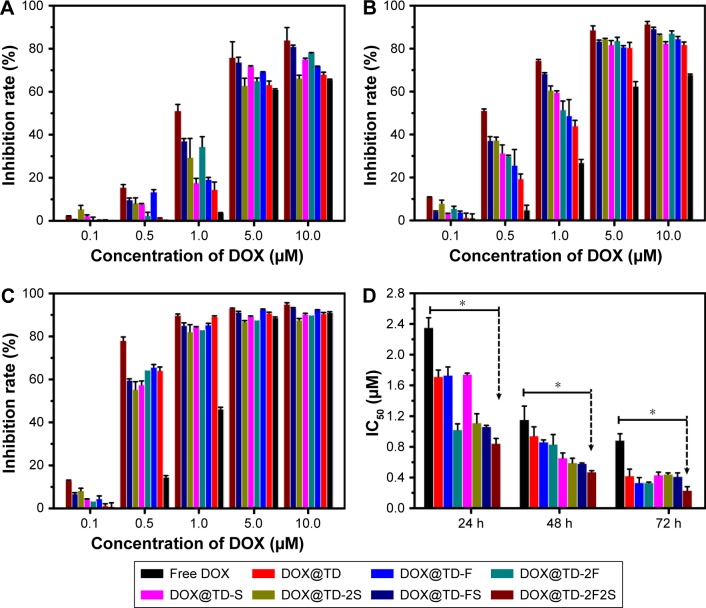
In vitro HT-29 cell inhibition analysis at varied concentrations of the listed treatments at (A) 24 h, (B) 48 h, (C) 72 h, and (D) IC50 values of HT-29 cells by the listed treatments.
Notes: Data presented as mean value ± SD (n=3). *Free DOX vs DOX@TD-2F2S, P<0.01.
Abbreviations: IC50, inhibitory concentration of 50%; DOX, doxorubicin; TD, tetrahedron; F, folic acid; S, SL2B; SD, standard deviation.

