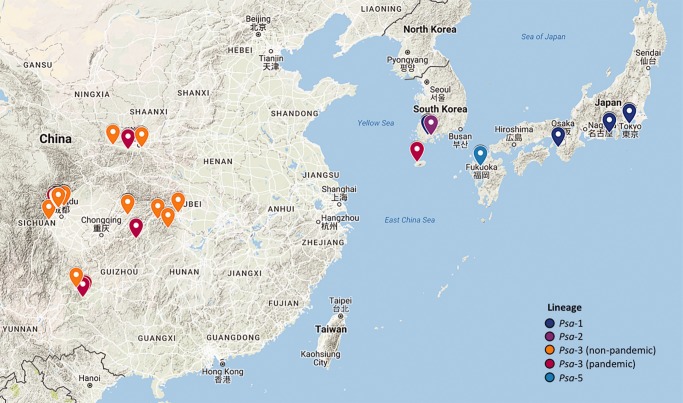
Fig. 3.—
Psa isolation locations in East Asia. Markers correspond to location of isolation. Color corresponds to the isolate membership in each clade according to the phylogeny displayed in fig. 1. Only isolates for which the specific location of isolation is known are displayed here.

