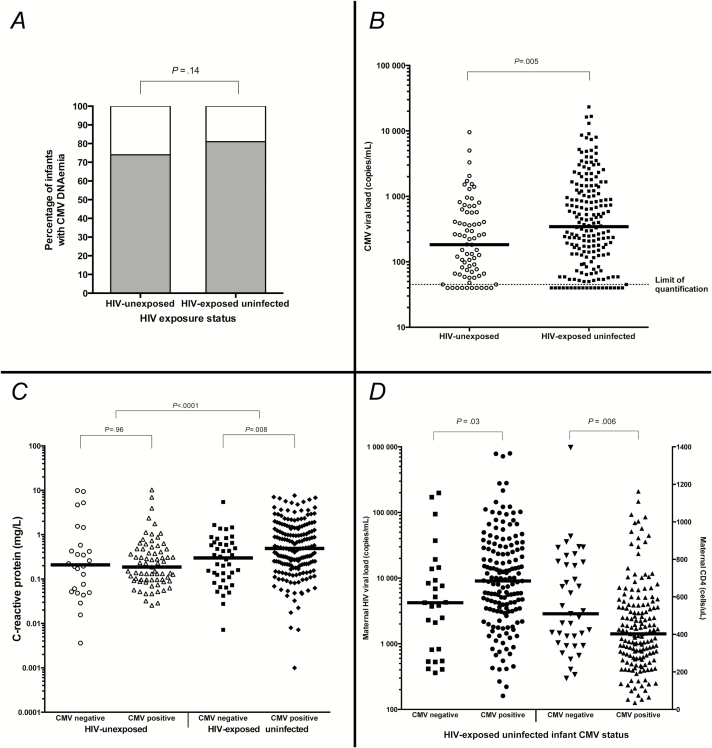
Figure 1.
Relationship between cytomegalovirus (CMV), C-reactive protein (CRP), and human immunodeficiency virus (HIV) exposure status. A, Prevalence of CMV DNAemia at 6 weeks of age in HIV-unexposed and HIV-exposed uninfected infants. Proportions in each group compared using Fisher’s exact test. B, CMV loads in HIV-unexposed and HIV-exposed uninfected infants. Horizontal line at median. Median CMV viral loads compared between HIV-exposed and HIV-unexposed infant groups using Mann–Whitney test. Limit of quantification of CMV load: 45 copies/mL; CMV-positive samples with viral loads below the limit of quantification were arbitrarily assigned CMV load values of 40 copies/mL. C, C-reactive protein in infants with and without CMV acquisition by 6 weeks of age, stratified by HIV exposure category. White circles: CMV-negative HIV-unexposed infants; white triangles: CMV-positive HIV-unexposed infants; black squares: CMV-negative HIV-exposed uninfected infants; black diamonds: CMV-positive HIV-exposed uninfected infants. Horizontal line at median. All comparisons undertaken using Mann–Whitney tests. D, Maternal HIV disease severity in HEU infants with and without CMV acquisition by 6 weeks of age. Left y-axis: maternal HIV load; right y-axis: maternal CD4 count. Black squares: maternal viral load in CMV-negative infants; black circles: maternal viral load in CMV-positive infants; black downwards-pointing triangles: maternal CD4 count in CMV-negative infants; black upwards-pointing triangles: maternal CD4 count in CMV-positive infants. HIV-exposed uninfected infants only. Horizontal line at median. All comparisons undertaken using Mann–Whitney tests.

