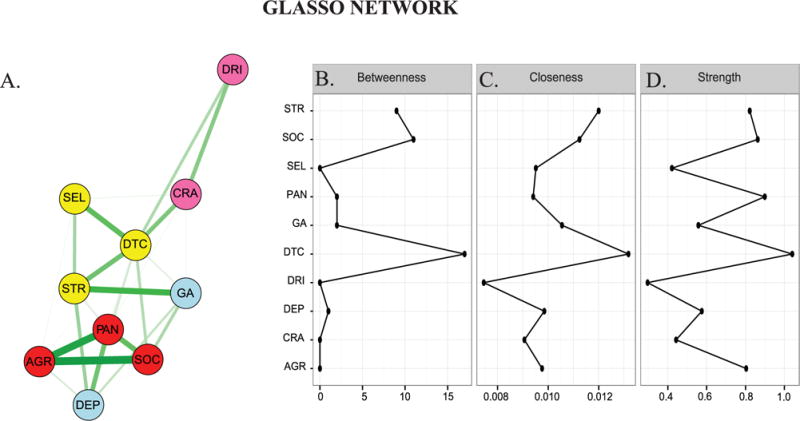
Figure 1.

GLASSO network structure (left panel) and corresponding centrality plots (right panels). Nodes/elements represent measures of internalizing disorders, perceived stress, alcohol craving, drinking behavior/total number of drinks consumed, DTC, and coping self-efficacy. Edges represent partial correlations between nodes (controlling for all other nodes) and edge widths represent the strength of element-element relationship according to the GLASSO algorithm. The algorithm removes edges that are at or near zero. See the online article for the color version of this figure.
