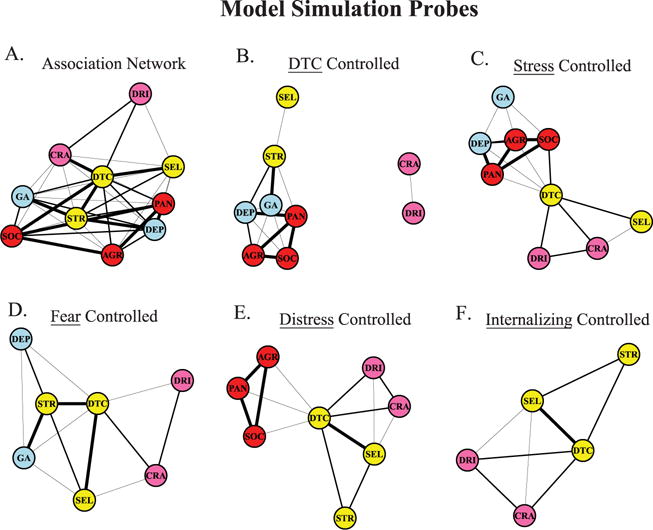
Figure 4.

Association network (Figure 4A; edges represent zero-order correlations) and networks after controlling for DTC (Figure 4B), perceived stress (Figure 4C), fear-related elements (Figure 4D), distress-related elements (Figure 4E), and all internalizing elements (Figure 4F). Edges represent semipartial correlations between nodes after controlling for the specified elements. Edge width corresponds to the following correlation values: thinnest width = 0.16 to 0.25, medium width = 0.26 to 0.35, thickest width = 0.36. Edges under 0.15 were omitted from the network. Nodes/elements represent measures of internalizing disorders (red = fear; blue = distress), coping measures (yellow), and drinking-related measures (pink). Edges under 0.15 were omitted from the network to facilitate interpretation of important relationships. See the online article for the color version of this figure.
