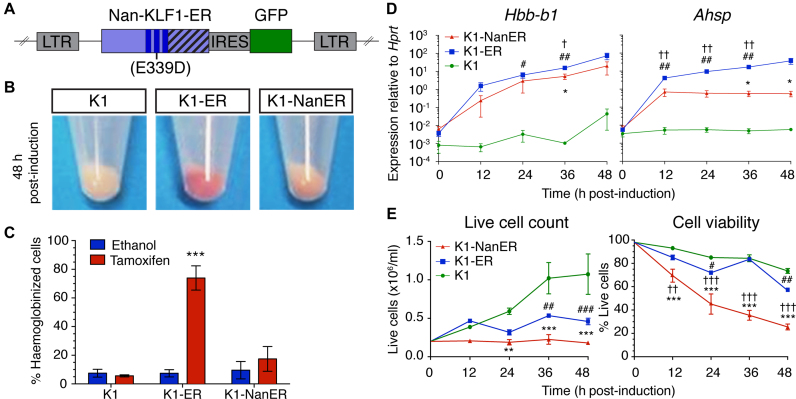
Figure 2.
K1-NanER cell lines provide an in vitro model of the Nan phenotype. (A) Schematic overview of the retroviral vector MSCV-Nan-KLF1-ER™-IRES-GFP used to transduce K1 cells. The introduced Nan mutation (Glu339Asp) is indicated within the second ZF (dark blue bars) of KLF1. Nan-KLF1 is expressed as an ER™ (striped bars) fusion protein. GFP; Green fluorescent protein, LTR; long-terminal repeat. (B) K1-NanER cells undergo less hemoglobinization (pink pellet) than K1-ER cells (red pellet) following induction by 4-OHT for 48 h. (C) K1-ER cells show significant hemoglobinization compared to ethanol treated controls, determined by the percentage of cells staining DAF positive within 48 h. Data are represented as mean ± SEM from 3 clonally independent cell lines. ***P < 0.001 (Student's t-test). (D) Expression of Hbb-b1 and Ahsp following induction K1-ER and K1-NanER cells by 4-OHT as determined by qRT-PCR. Each point shown is the mean ± SEM for three clonally independent replicates normalized to the expression of Hprt compared to parental K1 cells. *P < 0.05 for K1-NanER; #P < 0.05, ##P < 0.01 for K1-ER; †P < 0.05 for comparison between K1-NanER and K1-ER (Student's t-test). (E) Activation of Nan-KLF1 and KLF1 halts cell proliferation while Nan-KLF1 also reduces cell viability (n = 3 clonally independent cell lines). Live cell count was performed using trypan blue exclusion. A two-way ANOVA with Bonferroni post-test correction was used to determine significant differences between groups. Graphs show mean ± SEM. *P < 0.05, **P < 0.01 ***P < 0.001 for K1-NanER; #P < 0.05, ##P < 0.01 ###P < 0.001 for K1-ER; †P < 0.05, ††P < 0.01 †††P < 0.001 for comparison between K1-NanER and K1-ER.

