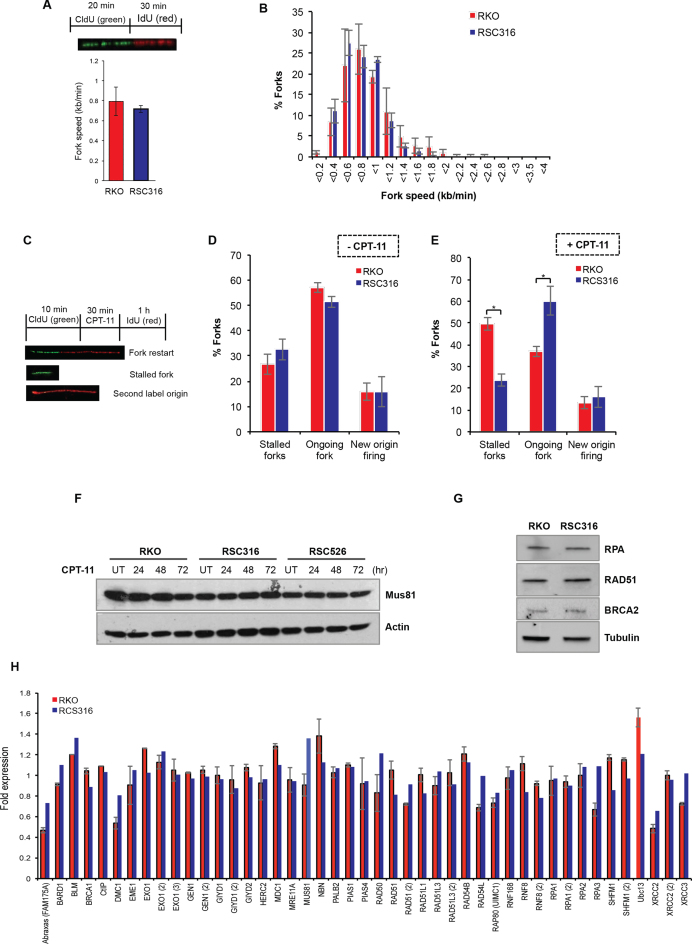
Figure 5.
Irinotecan-resistant cells display more fork restart events but no detectable change in HR factors. (A) Parental RKO and its derivative RSC316 irinotecan-resistant cells were pulse labeled with CldU for 20 min to label newly replicated DNA, followed by IdU for 30 min to measure replication fork speed. DNA fibres were spread on superfrost slides, fixed, and stored at 4°C. DNA fibers were subjected to acid denaturation using 2.5 M HCl. Slides were then stained with a mixture of rat anti-BrdU (clone BU1/75, Serotec) targeting CldU and mouse anti-BrdU (clone B44; Becton Dickinson) targeting IdU. DNA fibres were visualised using donkey anti-rat Alexafluor 488 and goat anti-mouse Alexafluor 555 secondary antibodies on an Olympus BX53 fluorescence upright microscope. Lengths of the fibres were measured, and speeds of the forks were determined using speed = length (kb)/time (min). Data are the average of three biological replicates ± SEM. Inset: Schematic depicting the DNA labelling procedure. (B) The average distribution of fork speeds is depicted from three biological replicates ± SEM. (C) A schematic showing the labelling procedure and the different replication fork structures; green-red signals represent on-going forks, green only represent stalled forks, and red only represent new origin firing. (D and E) Parental RKO and its derivative irinotecan-resistant cells were pulse labelled with CldU for 10 min to label newly replicated DNA, followed by treatment with DMSO ‘-CPT-11’ (D) or 50 μM CPT-11 ‘+CPT-11’ (E) for 30 min, followed by 1 h incubation with IdU. DNA fibres were spread on superfrost slides, fixed, and processed as described in ‘A’. At least 238 fork structures were counted per sample and the average number of stalled forks, fork restart ‘ongoing forks’, and new origin firing was quantified from three biological replicates ± SEM. Asterisks denote statistical significance; *P < 0.05, Student's t-test. (F and G) Cell lysates from the indicated cell lines were fractionated by SDS-PAGE and analysed by immunoblotting. (H) Parental and resistant cells were exposed to CPT and mRNA extracted using RNeasy mini RNA purification kit. mRNA was subjected to microarray analysis using a HumanHT-12 v4 WG-GX Beadchip on the Illumina BeadArray system. Expression changes of HR genes in resistant cells were presented as fold change relative to the parental RKO cells. Data are the average of two independent biological repeats ± range.

