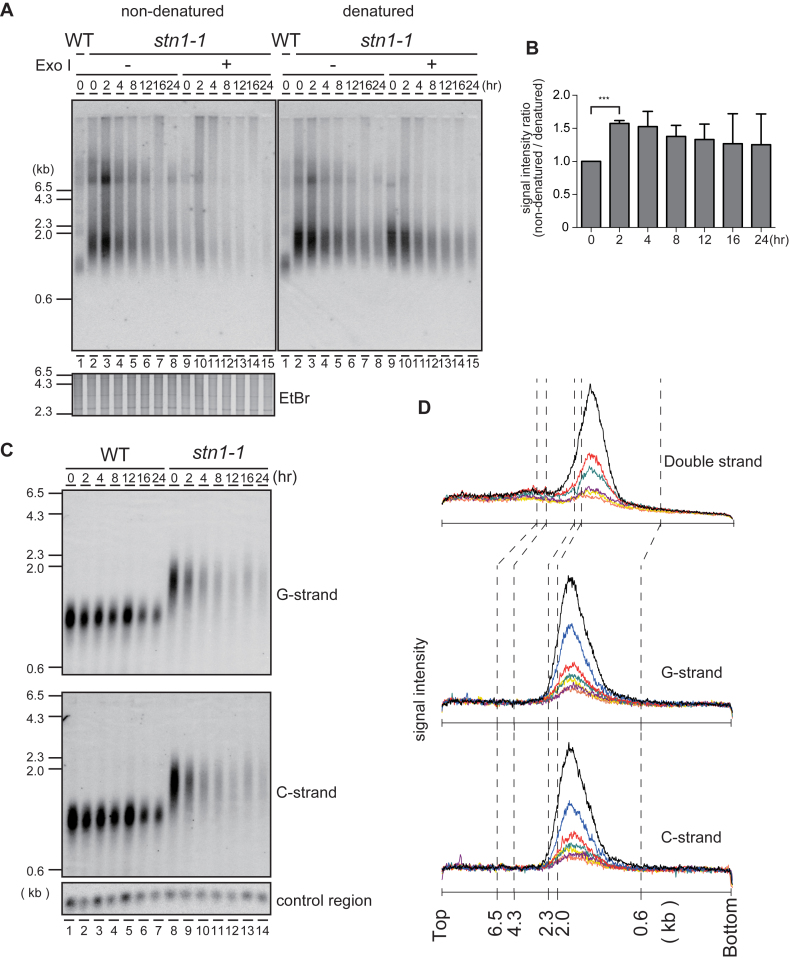
Figure 3.
The G-tail is transiently exposed at Stn1-dysfunctional telomeres. (A) An analysis of EcoRI-digested genomic DNA was performed with in-gel non-denaturing hybridization using a C-rich telomeric probe (left). The same gel was denatured and re-hybridized with the same probe (right). The EtBr-stained gel was photographed before hybridization. (B) The signal intensities between 0.6 and 4.3 kb were quantified in Figure 3A denatured and non-denatured lanes 2–8. Ratios of intensities for non-denatured versus denatured signals were calculated for each time point, and the ratios were normalized to the 0 h time point. Error bars show mean values of three independent experiments with SD. *** P value was 0.0020 calculated with a two-tailed Student's t-test. (C) EcoRI-digested genomic DNAs were electrophoresed in an alkaline-denaturing gel, and Southern hybridization was performed with a telomeric C-rich probe (upper, G-strand) and G-rich probe (middle, C-strand). (D) The signal quantifications from the top of the gel to the bottom were obtained from: Figure 1E standard gel electrophoresis (upper plot); Figure 3C, G-strand (middle plot); and Figure 3C, C-strand (lower plot). stn1-1 cultured at 36°C for 0 h (black), 2 h (blue), 4 h (red), 8 h (green), 12 h (purple), 16 h (yellow) and 24 h (orange) were quantified.

