Figure 7.
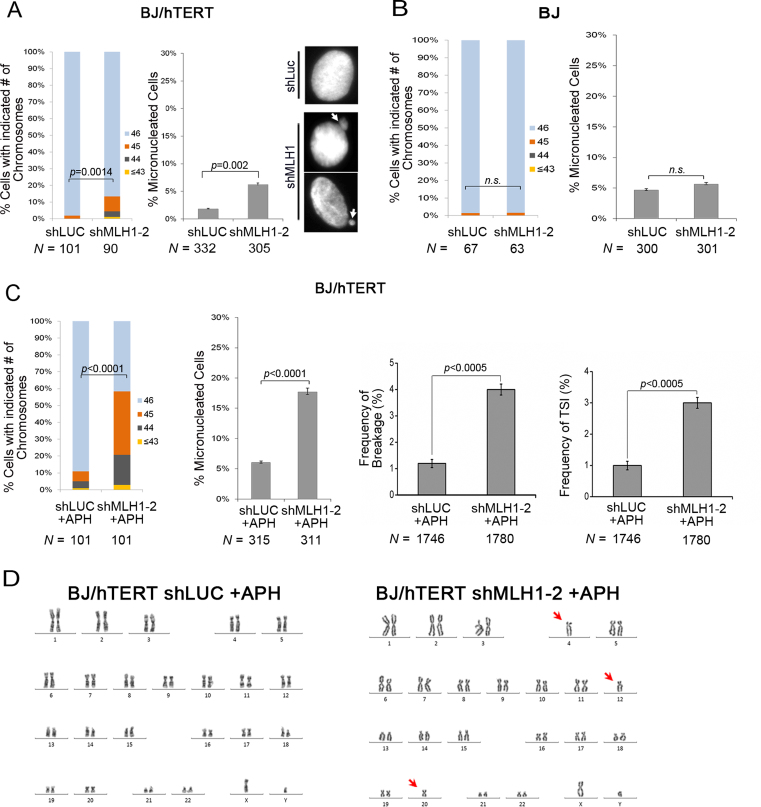
TSI correlates with chromosome instabilities. (A) MLH1 deficiency resulted in an increase in chromosome loss and MN formation in BJ/hTERT. N denotes the number of metaphase spreads (for chromosome loss) or the number of interphase cells (for MN formation) analyzed in each sample. White arrows point to MN formed in shMLH1 expressing cells. (B) Chromosome instabilities and MN formation in BJ cells with MLH1 deficiency. (C) Frequency of chromosome loss, MN formation, chromosome breakage and %TSI in BJ/hTERT control and shMLH1 cells under replication stress (0.3 μM APH, 24 h). (D) An example of karyotypes of BJ/hTERT MLH1 knockdown cells after APH treatment. Arrows point to chromosome loss. Each experiment was repeated with three independent replicates. Chromosome loss was evaluated using a binomial Z-statistic to compare the proportion of intact metaphase spreads (spreads with 46 chromosome).

