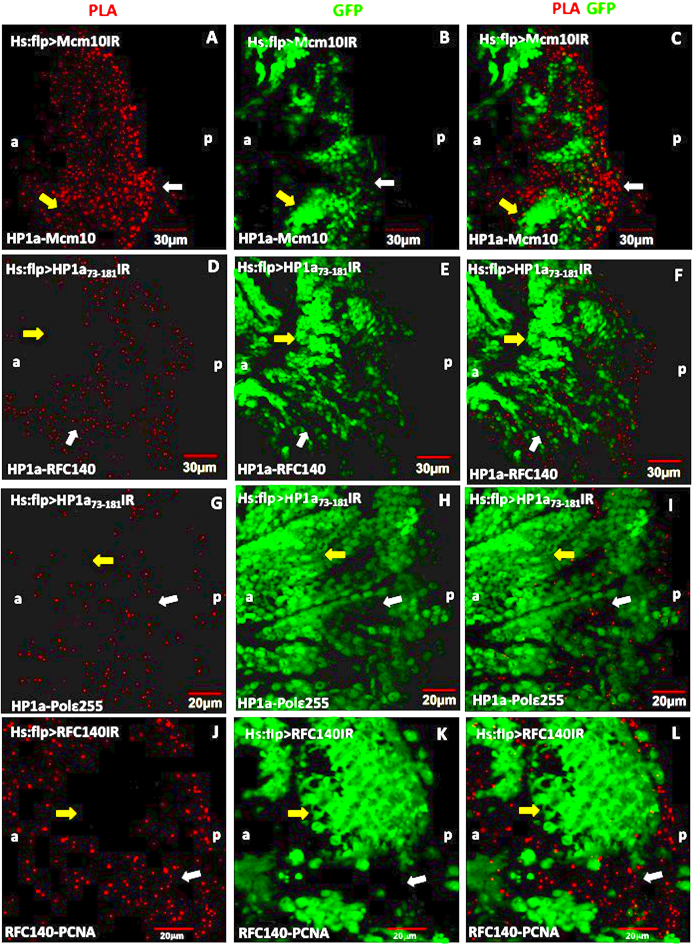
Figure 3.
Flip-out experiments combined with the PLA assays showing the interactions between HP1a and Mcm10, HP1a and RFC140, HP1a and dpolε255. Eye imaginal discs from flip-out experiments with UAS-Mcm10IR (A–C), UAS-HP1a73-181IR (D–F), UAS-HP1a119-206IR (G–I), UAS-RFC140IR (J–L) flies were performed PLA (red). (A–C) PLA between HP1a and Mcm10, (D–F) PLA between HP1a and RFC140, (G–I) PLA assays between HP1a and dpolε255. The cells expressing Mcm10 dsRNA (B), HP1a73-181 dsRNA (E and H) and RFC140 dsRNA (K) are marked with GFP (green). The PLA signals were mostly detected in non-GFP clones (yellow arrows), while in GFP clones, the PLA signals were significantly reduced (white arrows). Scale bars indicate 20 or 30 μm. (a) indicates anterior, (p) indicates posterior.

