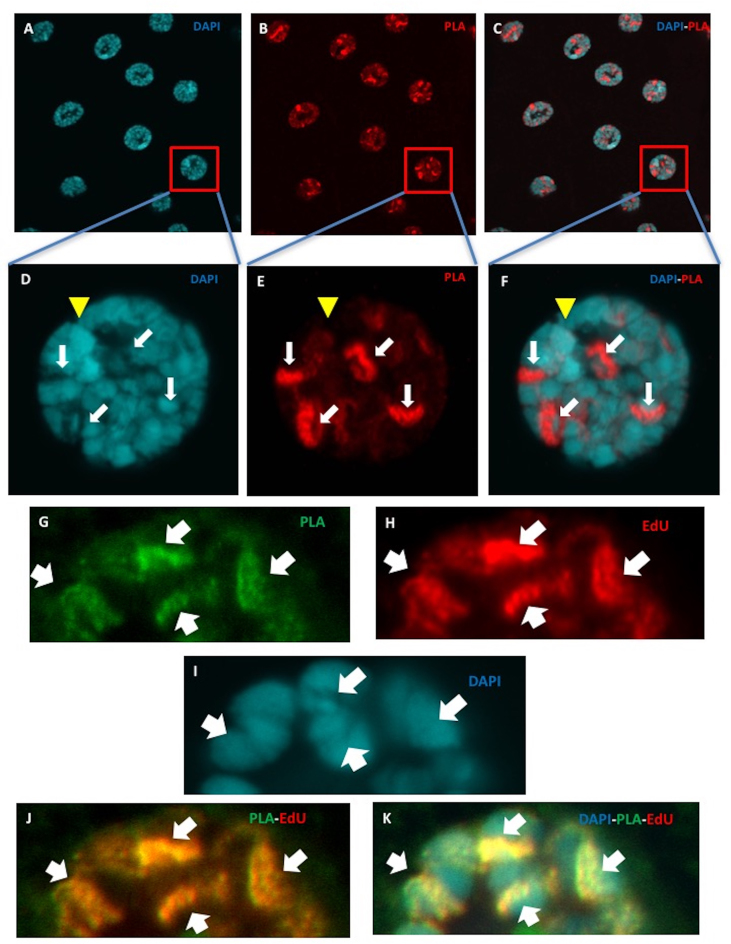
Figure 6.
Visualisation of in situ interaction between Drosophila Mcm10 and DNA polymerase α at replication fork in endocycle in salivary glands of wild type Canton S. (A–F) Salivary glands of Canton S were subjected to PLA assays (red) (B and E) and then were stained with DAPI (blue) (A and D). (C and F) Merged images between PLA and DAPI signals. (D–F) Higher magnification images of an indicated single nucleus. The bright red PLA signals represent the direct interaction between Mcm10 and DNA polymerase α in the nucleus (B and E, white arrows) and these interactions are excluded from the DAPI dense regions (C and F). Yellow arrowheads indicate heterochromatic chromocenters. (G–K) Salivary glands were labeled with EdU (Red), performed with PLA assays (green) and stained with DAPI (blue). The PLA signals fully coincide with EdU signals showing that Mcm10 and DNA polymerase α are in close proximity at the replication forks where DNA replication occurs. The flies were reared at 25°C.

