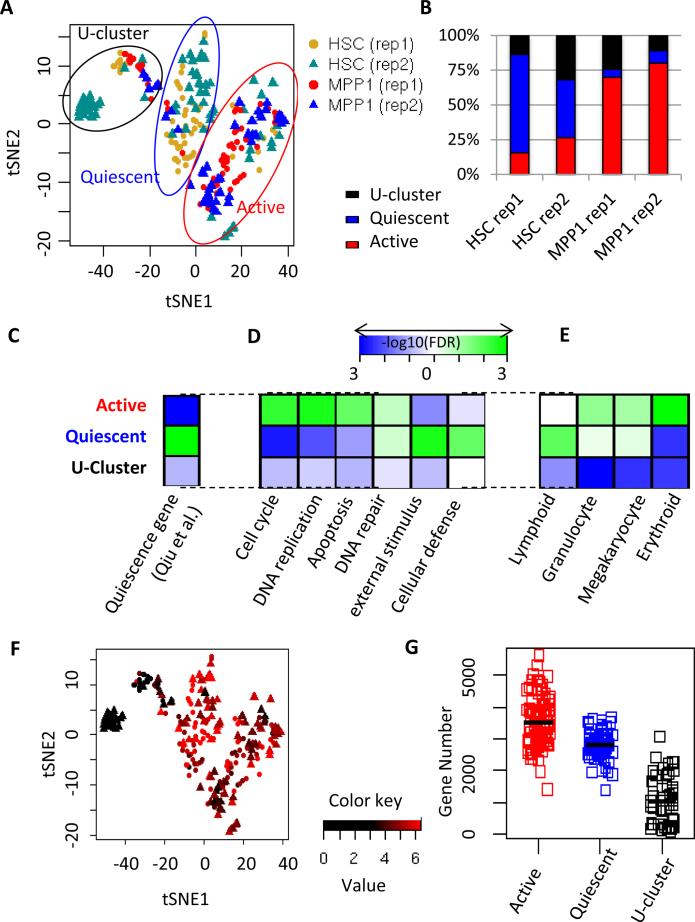
Figure 2.
Classification of HSC and MPP1 single cells into three main subpopulations. (A) Dimensional reduction by tSNE separating HSC and MPP1 into three major clusters: U-, quiescent and active clusters. (B) Fraction of HSC and MPP1 cells falling into three major clusters in two biological replicates based on single cell RNA-seq. (C, D, E) GSEA analysis. (C) Quiescence-related genes (18). (D) Genes related to representative GO biological processes in the three major clusters. (E) Different lineages related genes among the three major clusters. (F) Comparison to (A) for the distribution of HSC and MPP1 cells displaying gene expression related to interferon response which mostly are in quiescent cluster. Average expression of ‘interferon gamma response-related’ genes (Supplementary Table S5) are shown. Red represents a higher level of expression and black a lower level. The dots are HSC, the triangles are MPP1, and two replicates are combined. (G) Comparison of the number of detected genes among three clusters.

