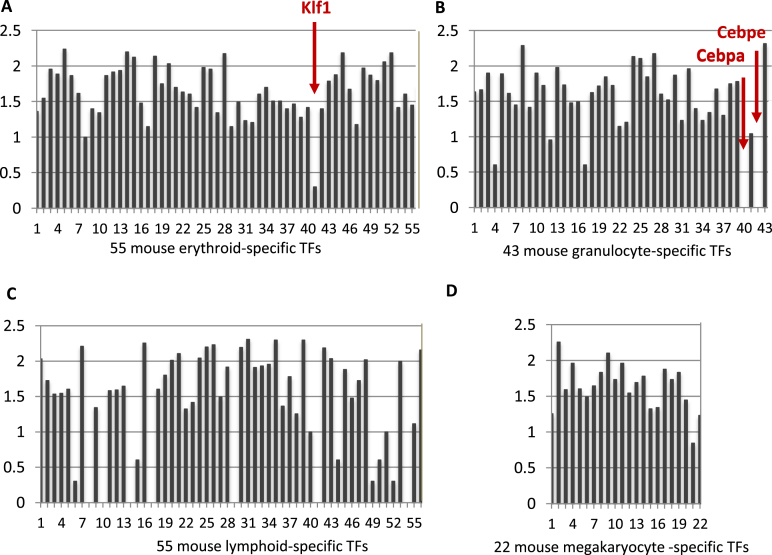
Figure 6.
The expression of the transcription factors (TFs) specifically elevated in different lineages in mouse HSC and MPP1 single cells. The X axis presents the different TFs (Supplementary Table S9); the Y axis represents the log10 of the number of cells in which the TF mRNA was detected (plus 1 to avoid logs of numbers less than 0). In total 228 single cells were analyzed, combining replicate 1 and 2. (A) Klf1 is the least expressed among 55 TFs for the erythroid lineage although it is one of the most highly expressed factors in maturing erythroid cells. (B) Cebpa and Cebpe were depleted in contrast to the other 41 TFs for granulocyte lineage. (C) Seven TFs were not detected and several other TFs are very low among 55 TFs specific for lymphocyte lineage. (D) All of the list of 22 TFs expressed selectively in maturing megakaryocytes are expressed in a substantial fraction of the HSC/MPP1 cells.

