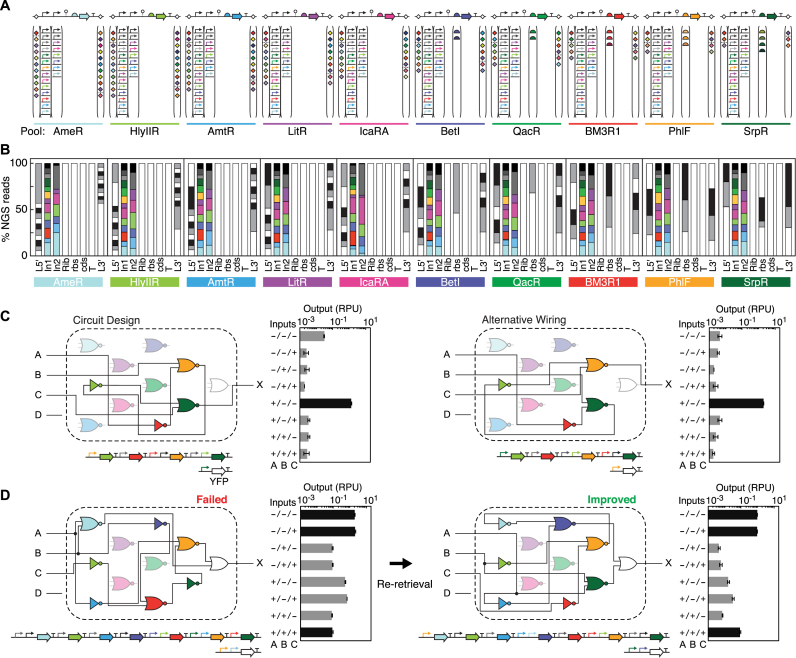
Figure 4.
Design space encompassing all possible circuits. (A) Pool designs for NOR gates with one repressor (71) in each pool. A pool of NOT gates (one input promoter) and NOR gates (two tandem input promoters) was constructed for each repressor (20 pools total). Linkers for the forward and reverse orientations were mixed separately in two multiplex PCR reactions; the dashed line represents this split. Colors represent each of the 10 repressors and their corresponding promoters. Assembly parts are colored in the order shown in Supplementary Data. (B) Representation of parts in the sequence-perfect constructs (% NGS reads that perfectly match a composite part design) at each position in the NOR pools. Approximately 5 million NGS reads per pool were sequenced and analyzed. Part type abbreviations: 5΄ linker (L5’), input promoter 1 (In1), input promoter 2 (In2), hammerhead ribozyme (Rib), RBS (rbs), CDS (cds), terminator (T) and 3΄ linker (L3’). Part sequences are listed in Supplementary Data. Input promoter positions are colored according to its corresponding repressor and in the order listed in Supplementary Data (bottom to top). (C) Using the Cello software (19), a circuit was designed for a 3-input logic function (output 00001000) and an alternative gate assignment was subsequently tested. The circuit wiring diagrams are drawn showing all possible gates in a fixed position (10 repressor gates and output OR gate) with lines connecting the gates to show the wiring of input(s) and output for each gate. Gate symbols are colored according to the repressor and lightly shaded if not present in the circuit. For each circuit design, the constructs were built by retrieving the gates from the pools with all-forward orientation and one-pot Type IIS assembly into a backbone with the corresponding 3-input sensor block. Circuits were tested under all 8 input states (presence or absence of 1 mM IPTG, 2 ng/ml aTc and 5 mM L-arabinose) and YFP expression was analyzed by flow cytometry (n = 20 000). Bars are colored to show if predicted output expression is high (black) or low (grey). The average and standard deviation are calculated from triplicate experiments performed on different days. (D) For a 3-input logic function (output 11000001) requiring seven NOT and NOR gates, an initial design failed to generate the desired function. An alternative wiring of gates was tested by re-retrieval from the gate pools.

