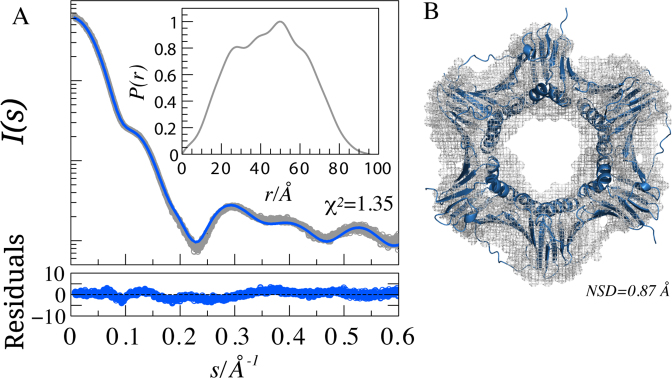
Figure 1.
SAXS analysis of PCNA. (A) SAXS intensity profile of free PCNA (open circles), I(s), is represented in logarithmic scale as a function of the momentum of transfer, s = (4π sin θ)/λ, where 2θ is the scattering angle. The solid line corresponds to the predicted SAXS profile of the PCNA crystal structure (4D2G) (blue) with WAXSiS (χ2 = 1.35). Point-by-point residuals of the fitting computed using the absolute values of the curve are displayed at the bottom. The inset shows the pair distance distribution function for PCNA calculated from the data in the range 0.068 < s < 0.5 Å−1. (B) Superposition of the crystallographic structure of PCNA and the ab initio reconstruction determined using DAMMIN (42). The structures have a Normalized Spatial Discrepancy (85) (NSD) of 0.87 Å.

