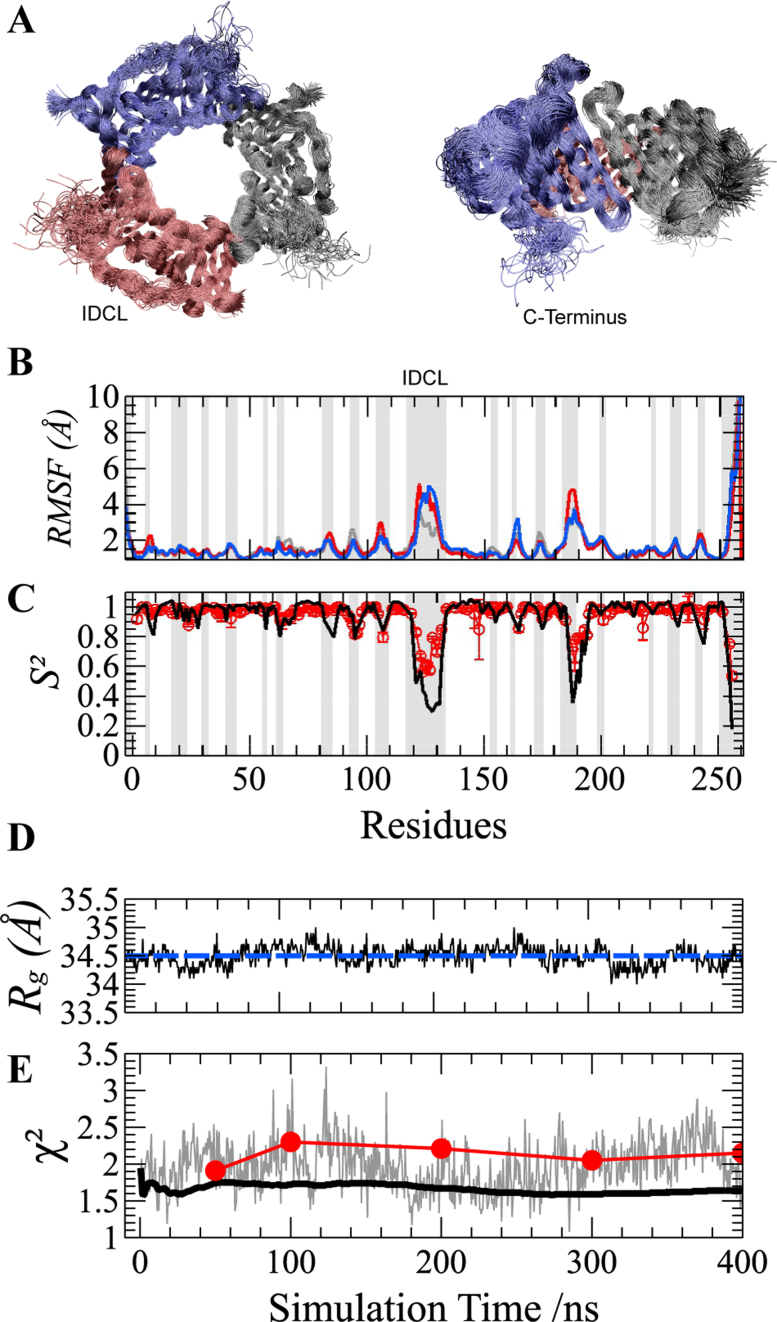
Figure 2.
Molecular Dynamics (MD) simulation of the PCNA ring. (A) Two orthogonal views of the overlay of 100 structures sampled at regular intervals during the 400 ns MD simulation. The superposition was based on a Maximum Likelihood method implemented in Theseus (59). Different protomers forming the PCNA trimer are shown in blue, red and gray. (B) Cα Root-Mean-Square Fluctuations (RMSF) and (C) N–H bond order parameters (S2) for PCNA residues. RMSF profiles of individual protomers are highlighted using the same color code as described above. MD-derived S2 values (black line) are multiplied by a common scaling factor to best reproduce those obtained by model-free analysis of experimental NMR relaxation data (28) (red circles with error bars). RMSF and S2 patterns show that only loops and the C-terminus display fast motions. Loops are highlighted by gray-shaded areas for reference. (D) Validation of PCNA MD by SAXS. MD-snapshots fluctuate around the experimental Rg value (blue dashed line). (E) The χ2 values obtained from the comparison between the calculated SAXS curve from each MD-snapshot and the experimental one is shown in gray. The χ2 values of the comparison of the experimental curve with the computed time-dependent averaging of SAXS profiles over 400 ns MD trajectory predicted including (black solid line) or not (red circles) solvent and side-chain fluctuations.

