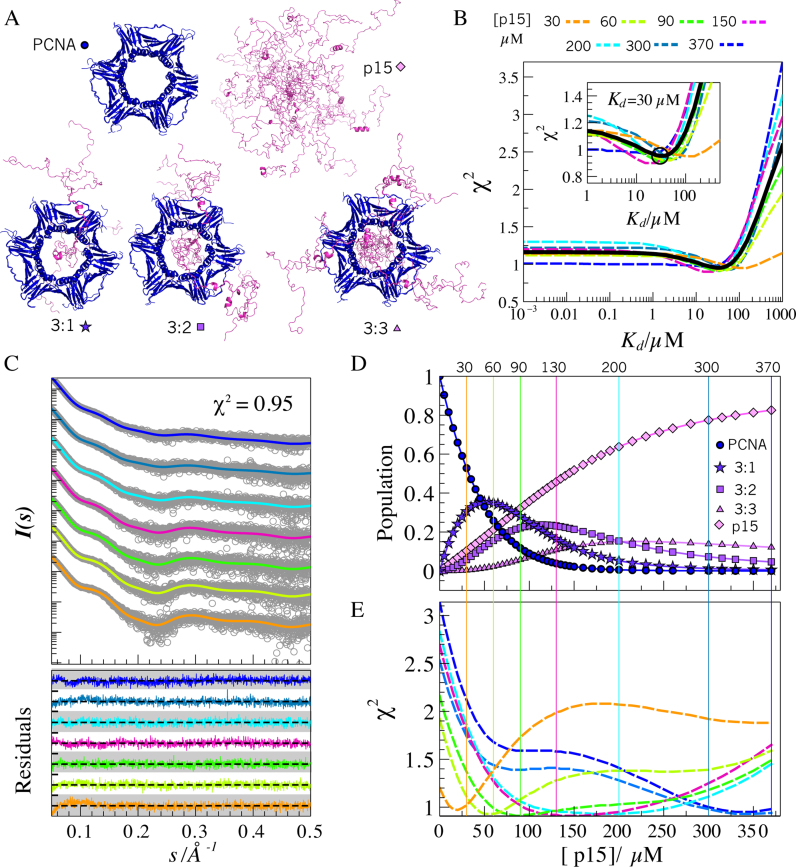
Figure 5.
SAXS modeling of PCNA–p15 mixtures. (A) Representatives of all-atom ensembles generated for the five individual coexisting species in solution. PCNA (blue) and p15 (magenta) structures are in ribbon representation. (B) χ2 assessment of the screening over Kd values from 10−3 to 103 μM obtained for each p15 titration point (dashed-lines): 30 (orange), 60 (yellow-green), 90 (green), 150 (pink), 200 (cyan), 300 (blue) and 370 μM (dark blue), and for all SAXS curves analyzed collectively (black solid line). Inset: Zoom of the grid-search profiles showing a minimum around Kd = 30 μM. (C) Simulated SAXS profiles (solid lines and the same color code as in panel B) for each titration point with a Kd = 30 μM, superimposed to the experimental SAXS data (gray circles). Residuals using absolute values are displayed at the bottom with the same color code, with a scale going from –4.0 to 4.0 (white and gray bands). (D) Evolution of the molar fraction of the five species over the titration, assuming a Kd = 30 μM. (E) Discrepancy (χ2) of the individual experimental SAXS curves with respect to simulated SAXS profiles in which the Kd was fixed to 30 μM and the p15 concentration was varied from 0 to 370 μM. The same color code as in panels B and C was used. Vertical lines represent the experimentally added concentration of p15 at each titration point. The coincidence of the minimum of the χ2 profiles with the vertical lines of the same color substantiates the structural and thermodynamic model used to describe the titration data.

