Figure 1.
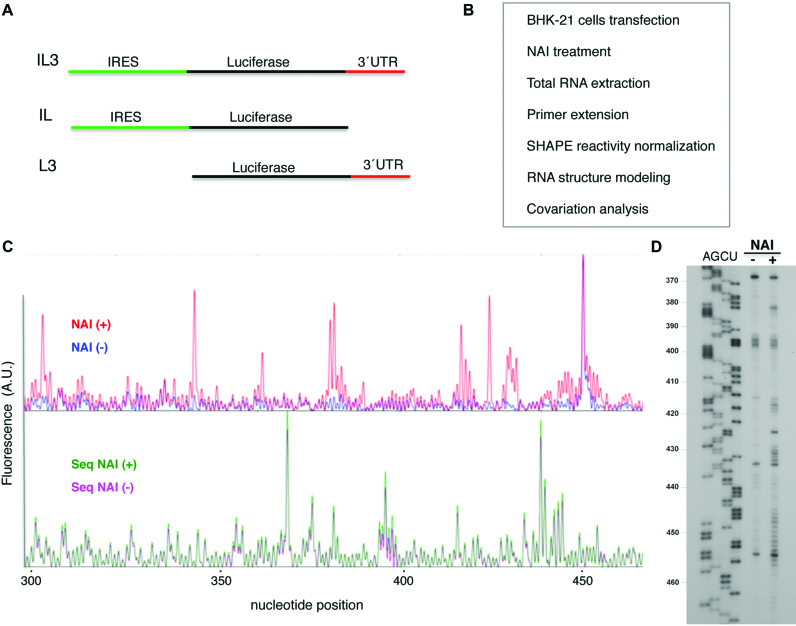
In-cell mapping of FMDV IRES and 3΄UTR structure. (A) Schematic of the transcripts used to determine RNA structure. (B) Experimental overview. BHK-21 cells were transfected with vectors expressing the transcripts depicted in (A); 20 h post-transfection cells were modified with NAI. Mock-transfected cells were treated as negative control. Following total RNA extraction, reverse transcription (RT) of modified and unmodified RNA generated cDNA products that provided a SHAPE reactivity map. Normalized NAI reactivity was used to generate models of RNA secondary structure. Covariation analysis was performed to identify conserved structural motifs. (C) Representative example of the fluorescence (arbitrary units) obtained using total RNA prepared from treated NAI (+) and untreated NAI (−) cells, fluorescent primers and capillary electrophoresis. For consistency, nucleotide positions are numbered as in previous studies (25). (D) Autoradiogram of a representative example of the RT stops observed using total RNA prepared from cells treated with NAI (+) and untreated (−), determined using radiolabeled primers and denaturing acrylamide-urea gel electrophoresis. AGCU denotes the sequence ladder obtained with same labeled primer. The IRES nucleotide positions are indicated on the left.

