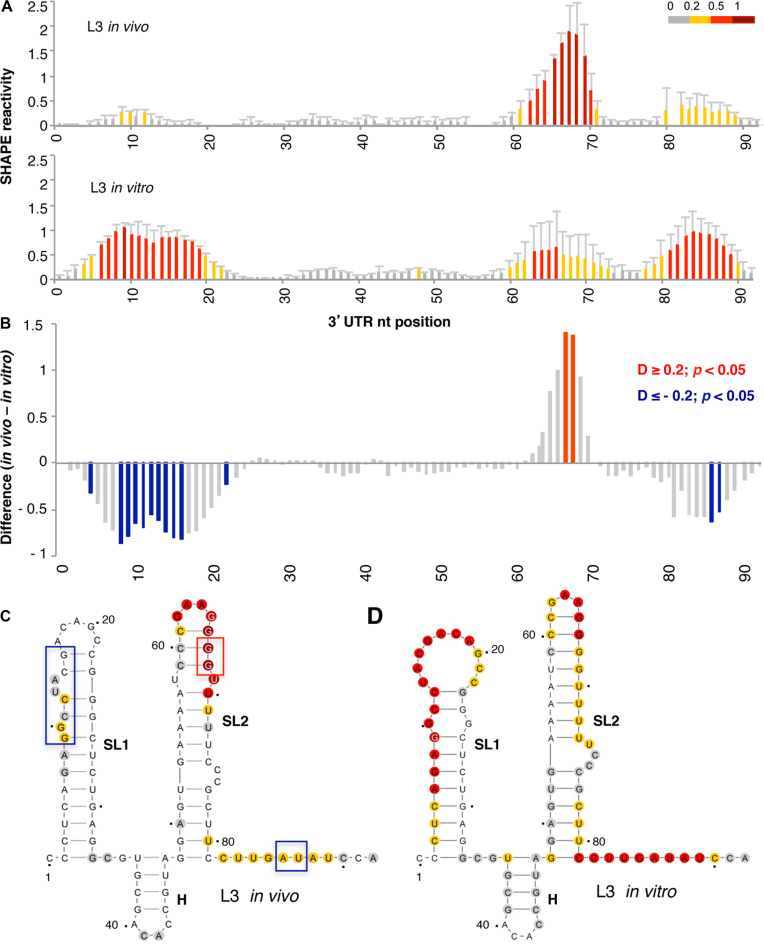
Figure 3.
Analysis of the 3΄UTR SHAPE reactivity in transfected cells expressing a functional monocistronic transcript. (A) Normalized 3΄UTR reactivity determined in vivo and in vitro as a function of the nucleotide position. RNA reactivity toward NAI is colored according to the scale shown on the right. Values correspond to the mean ± SD of three independent experiments. (B) Significant differences between in vivo and in vitro SHAPE reactivity. Red or blue bars depict nucleotides with P < 0.05 and absolute SHAPE reactivity differences (D) higher or lower than 0.2, respectively. Gray bars depict non-statistically significant differences. RNA secondary structure of the 3΄UTR generated imposing the reactivity towards NAI in vivo (C) and in vitro (D). Red and blue boxes depict enhanced or protected regions, respectively, observed in living cells relative to free RNA. Nucleotide numbers are marked every 20 nts; a dot marks every 10 nts, taking as 1 the first nt after the stop codon of the FMDV coding sequence. The location of stem-loops SL1, SL2 and H generated imposing SHAPE reactivity on RNAstructure software is indicated. The minimal free energy predicted structure is depicted in each case.

