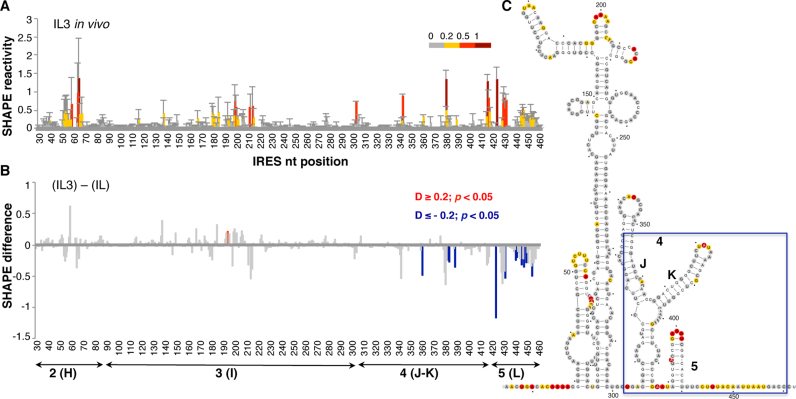
Figure 5.
Conformational changes in the IRES element in the presence of 3΄UTR. (A) SHAPE reactivity towards NAI in cells expressing the monocistronic IL3 transcript (top). Normalized IRES reactivity determined in vivo as a function of the nucleotide position. RNA reactivity is colored according to the scale shown on the right. Values correspond to the mean ± SD of three independent experiments. (B) Significant SHAPE differences within the IRES region in vivo between the transcript IL3 and IL (bottom). Red or blue bars depict nucleotides with P-values <0.05 and absolute SHAPE reactivity differences (D) higher or lower than 0.2, respectively. Grey bars depict non-statistically significant differences. (C) IRES secondary structure showing NAI reactivity, a blue box denotes protected positions on domains 4 and 5 on IL3 relative to the IL RNA.

