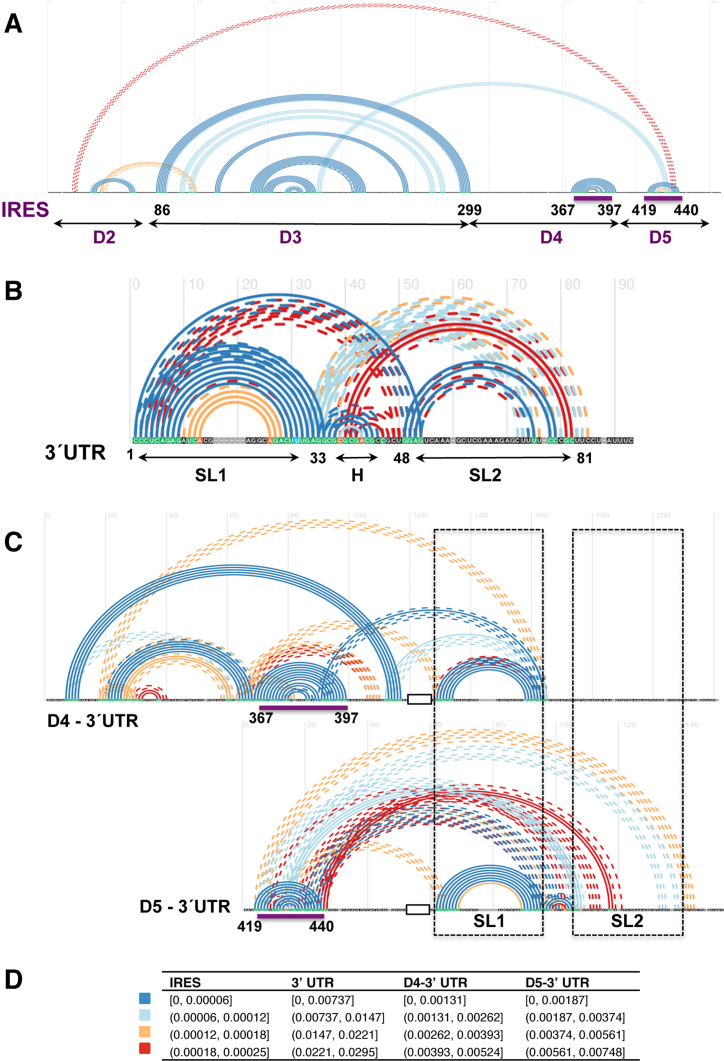
Figure 7.
In silico analysis of conserved helices between the IRES element and the 3΄UTR. Conserved helices predicted by TRANSAT for the sequence alignment of the IRES region alone (A), the 3΄UTR alone (B) and the chimeras D4-3΄UTR and D5-3΄UTR (C) for the P-value thresholds indicated in the legend (D). Arcs connect base pairs, colored according to their P-value range estimated by TRANSAT. Filled line arcs depict helices predicted with high reliability, broken line arcs depict mutually exclusive helices. The structural domains of the IRES and the stem–loops of the 3΄UTR are indicated on the x-axis, together with the nt position flanking each domain. Purple lines denote the positions of the IRES predicted to base pair with SL2; dashed black boxes depict the position of 3΄UTR SL1 and SL2 on the RNA chimeras. A black empty box depicts the A10 tract fusing the IRES domains with the 3΄UTR sequence.

