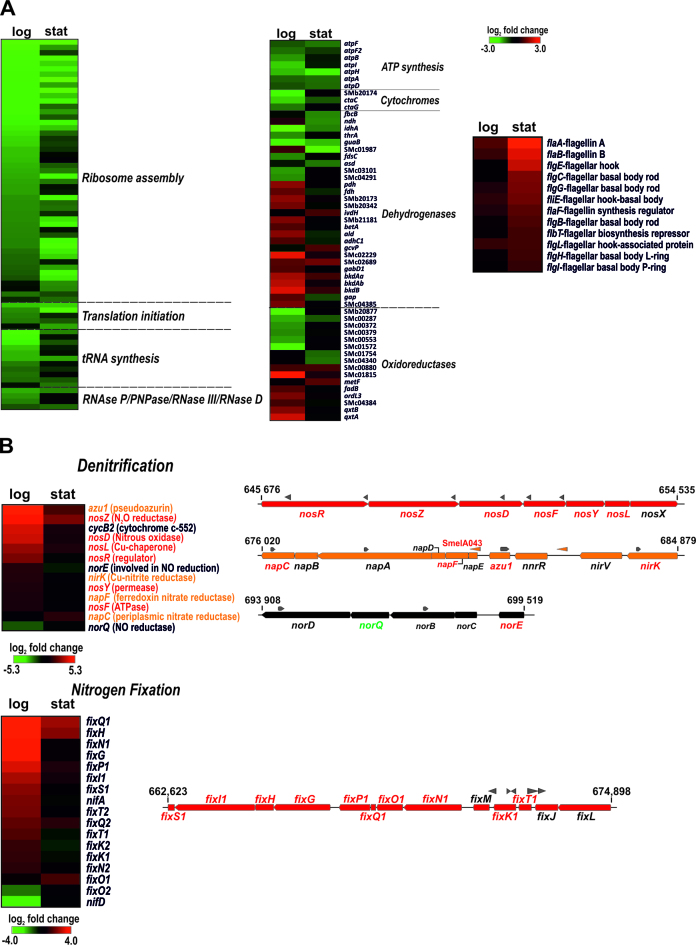
Figure 7.
Core and plasmid pathways influenced by SmYbeY. Changes in mRNA abundance in exponential (log) and stationary (stat) cultures are visualized in heatmaps generated with the MeV tool (http://www.tm4.org/mev.html). In the color scale (log2 fold changes) green and red stand for down- and up-regulation in the SmΔybeY mutant, respectively. (A) Chromosomal genes related to translation and RNA turnover (left), energy metabolism (middle) and flagella biosynthesis (right). (B) Genes of symbiotic plasmid pSymA involved in anaerobic denitrification (upper panel) and nitrogen-fixation (bottom panel). Gene clusters specifying each pathway are depicted to the side of each panel. Grew arrowheads stand for annotated asRNAs. The names of differentially expressed genes within each operon are colored.

