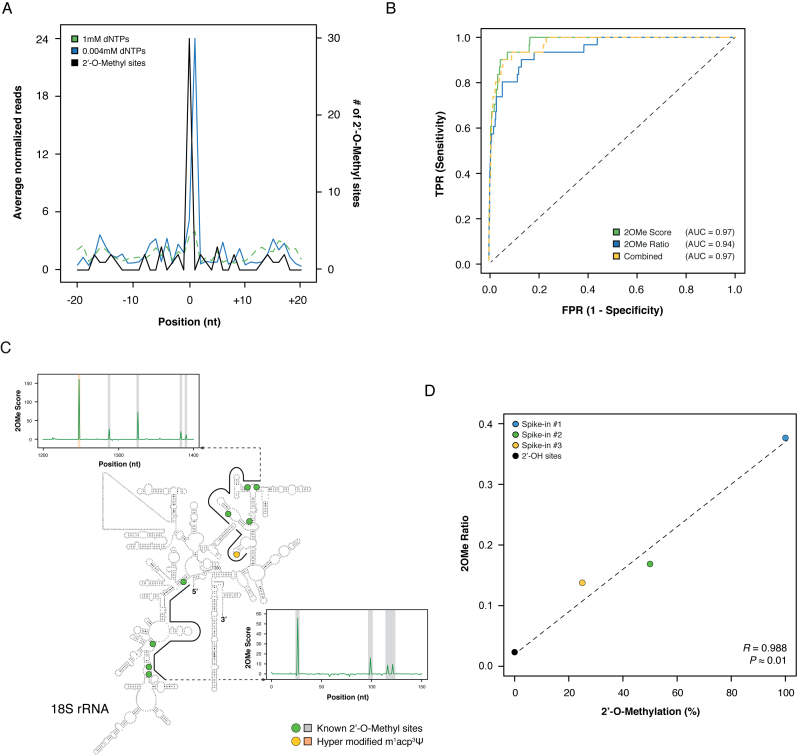
Figure 2.
Overview of the 2OMe-seq approach. (A) Meta-2OMe plot of the average normalized number of reads (left axis) for the 1 mM dNTPs (dashed green) and 0.004 mM dNTPs (solid blue) libraries on HeLa 18S rRNA. The number of 2΄-OMe residues at each position in the window is indicated (black, right axis). (B) ROC curves on HeLa 18S rRNA for 2OMe Score (solid green), 2OMe Ratio (solid blue), and their logistic combination (dashed yellow) trained on 28S rRNA. (C) Representative windows along HeLa 18S rRNA. Known 2΄-OMe sites are outlined by green dots on the secondary structure, and grey outlines on the 2OMe Score charts. The hyper modified m1acp3Ψ site previously reported to completely block RT (27) is indicated with a yellow dot on the secondary structure, and an orange outline on the 2OM Score chart. The secondary structure of the human 18S rRNA has been obtained from CRW website (34) (http://www.rna.icmb.utexas.edu/). (D) Scatterplot of the known methylation level versus the calculated 2OMe Ratio for the three synthetic spike-ins. Point 0 2OMe Ratio was calculated as the average of the 2OMe Ratio of all 2΄-OH bases of the three spike-ins.

