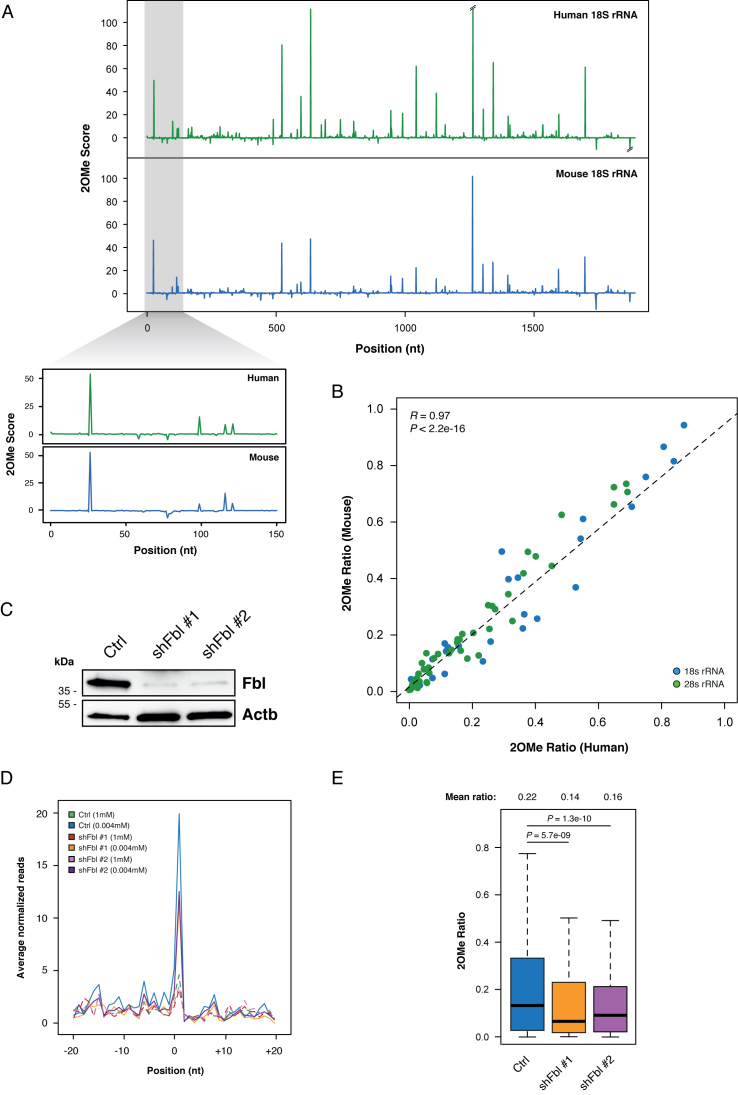
Figure 3.
2OMe-seq captures the relative modification stoichiometry and its variation. (A) 2OMe Score profiles for HeLa and ESCs 18S rRNA. (B) Scatterplot of the 2OMe Ratio measured in HeLa versus ESCs for each 2΄-OMe residue in the 18S (blue) and 28S (green) rRNAs. (C) Western blot of Fibrillarin in control and Fbl knockdown ESCs. Beta actin was used as the loading control. (D) Meta-2OMe plot of the average normalized number of reads (left axis) for the 1 mM dNTPs (dashed lines) and 0.004 mM dNTPs (solid lines) libraries on control and Fbl knockdown ESCs rRNA. (E) Boxplot of 2΄-O-methylation abundance measured by 2OMe Ratio in control and Fbl knockdown ESCs. Significance is given by Wilcoxon Rank Sum test statistics.

