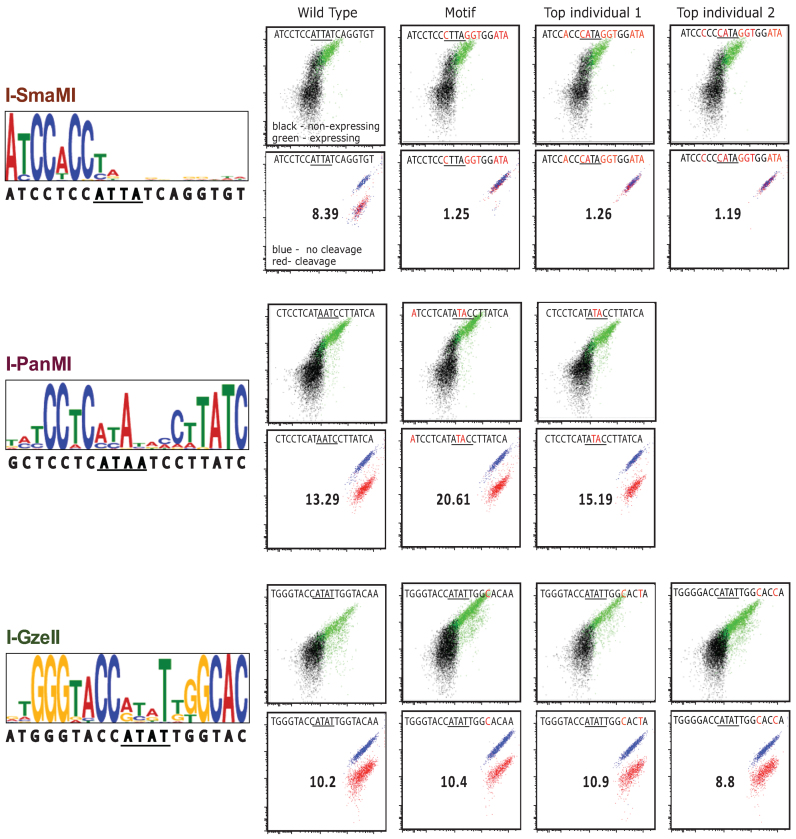
Figure 4.
SELEX motif binding and cleavage for benchmark enzymes. The left panel shows benchmark enzyme group motifs found by analyzing the SELEX sequences for each enzyme's SELEX5 oligonucleotide pool using the expect maximization tool, MEME. The wild-type targets are shown below the motifs. The flow cytometry plots represent flow binding analyses (top) and cleavage (bottom) of the indicated target oligonucleotides corresponding to targets previously identified by bioinformatics (first column), the SELEX motif and the top two most frequently represented oligonucleotide targets in the SELEX5 pool.

