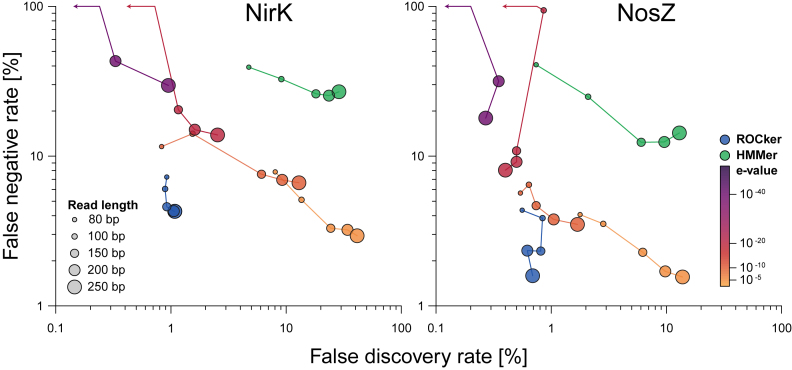
Figure 2.
Comparison of false negative and false positive rates for simulated shotgun data sets of different read lengths using ROCker profiles and e-value thresholds. Simulated shotgun data sets of 80, 100, 150, 200 and 250 bp read length (figure legend) were generated using ROCker and searched against reference NirK and NosZ protein sequences using BLASTx. The outputs were filtered using the calculated ROCker profiles (circles in blue) and fixed e-value thresholds (circles in orange to purple gradient). Results from hidden Markov models search of the references NirK and NosZ sequences against the simulated reads are also shown (circles in green).

