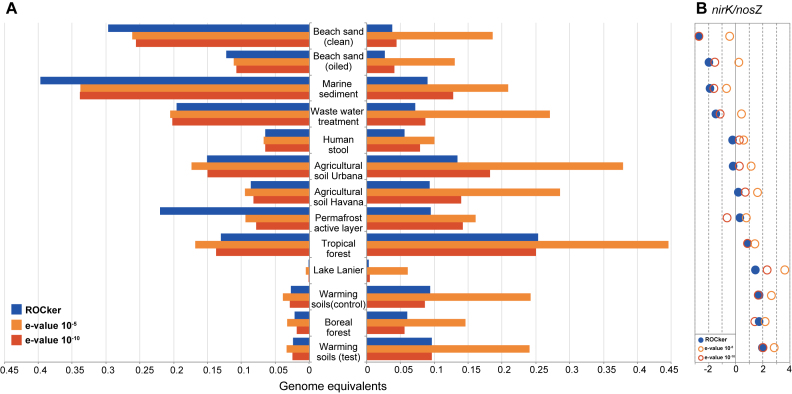
Figure 4.
Abundance for nirK and nosZ genes in short-read metagenomes calculated using ROCker or fixed e-value thresholds. Panel A shows the abundance, calculated as the fraction of the microbial community encoding nirK or nosZ, based on searching short-read metagenomes against NirK (a) and NosZ (b) reference protein sequences. BLASTx searches were filtered using the calculated ROCker profiles or fixed e-values (10−5 and 10−10). Panel B shows the log2 ratio of nirK/nosZ gene abundances using ROCker.

