
Figure 1. ZIKV mRNA LNP vaccine testing in AG129 mice.
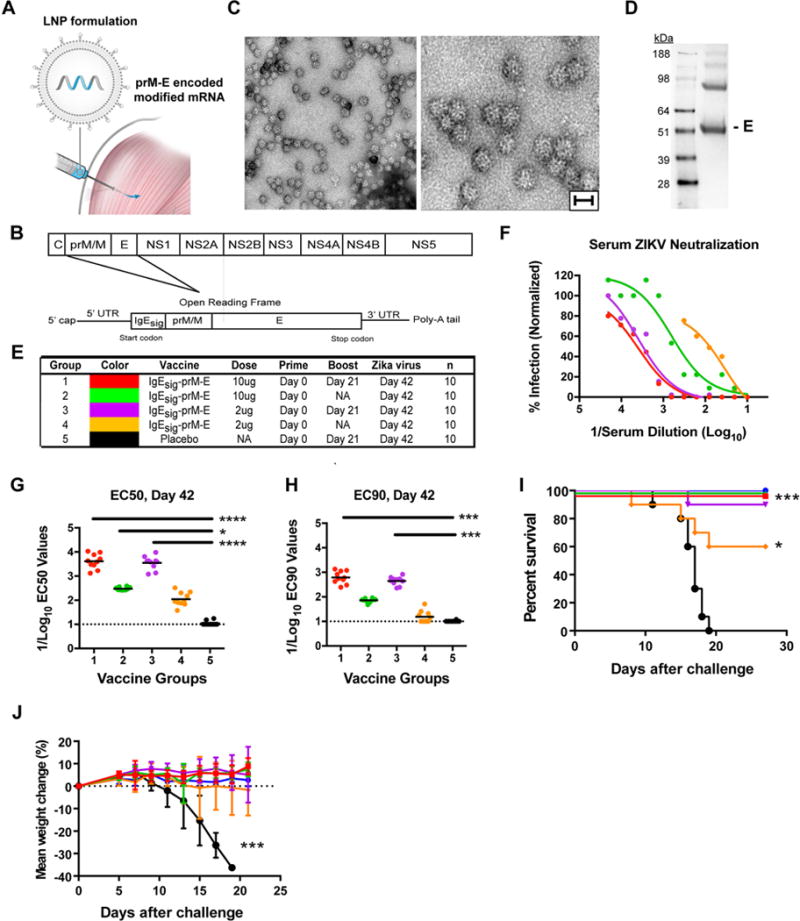
A. ZIKV prM-E modified mRNA is packaged into LNPs for intramuscular delivery. B. Schematic of ZIKV genome (top). An mRNA encoding the ZIKV prM/M and E structural genes was engineered (bottom). In this construct, prM is directed into the ER using a heterologous IgE signal sequence (IgEsig) at the amino-terminus. C. HeLa cells were transfected with prM-E mRNA, and SVPs in the supernatant were purified and concentrated by ultracentrifugation and then subjected to electron microscopy and negative staining. Low- and high-power images of purified SVPs are shown. Scale bar = 30 nm. One representative experiment of several is shown D. HeLa cell supernatants were collected for Western blotting under non-reducing conditions with a mAb against the ZIKV E protein. E. Scheme of immunization of AG129 mice with one (prime) or two (prime-boost) doses of 2 or 10 μg with IgEsig prM-E or placebo mRNA LNP vaccines. F–H. Serum was collected at 6 weeks after vaccination and analyzed for neutralization of ZIKV by PRNT assay. Representative curves are shown (F), and EC50 (G) and EC90 (H) values were calculated for individual animals in each group. Each point represents the mean of two independent experiments per animal. Data are a composite of two independent experiments with sera from each of the 10 animals per group. EC50 and EC90 data were analyzed by a Kruskal-Wallis test with a multiple comparisons correction and compared to the placebo LNP vaccine (*, P < 0.05; ***, P < 0.001; ****, P < 0.0001). The dashed lines indicate the limit of detection of the assay. I–J. AG129 Mice were challenged at 6 weeks post vaccination with 104 PFU of ZIKV P6-740. Animals were monitored for survival (I) and weight loss (J). Error bars indicate standard error the mean (SEM). Survival data was analyzed by the log rank test (*, P < 0.05; ***, P < 0.001). Weight loss was analyzed by two-way ANOVA (***, P < 0.001). See also related figures S1 and S2.