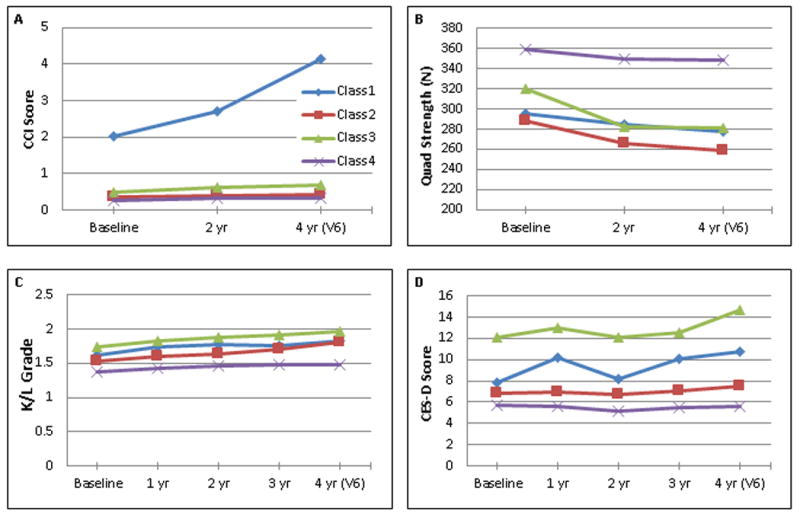
Figure 1.

Examination of phenotyping variables by class over time. Latent Class Analysis was applied to data from Visit 6 (V6). A) Charlson Comorbidity Index (CCI) score, B) isometric quadriceps force production, C) radiographic severity, as measured by Kellgren-Lawrence (K/L) grade, D) Center for Epidemiologic Studies—Depression subscale (CES-D) Score. Data were plotted based on availability. Not all measures were available at every yearly assessment.
